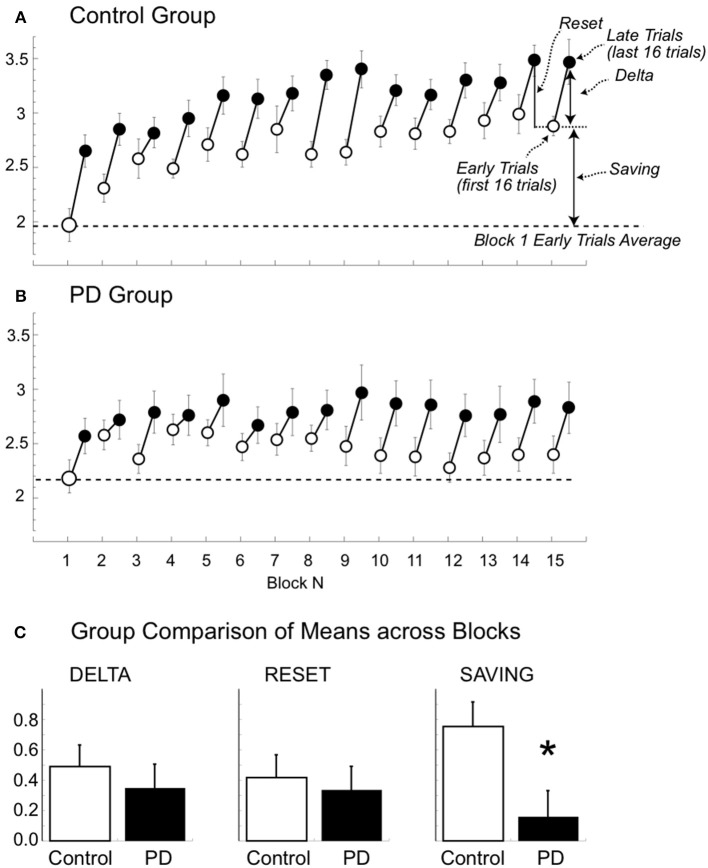
Figure 5.
Beta modulation depth of the early and late trials for the 15 blocks (A,B). Mean (±SE) beta modulation depth of the controls (A) and patient group (B) are plotted for the early (first 16 trials, empty circle) and late (last 16 trials, filled circle) trials for each of the 15 blocks. Data of day 1 and 2 were combined. The horizontal dotted and continuous lines represent the minimum and maximum mean values, respectively. In (A) we also illustrate the delta (i.e., difference between the modulation of early and late trials), the reset (i.e., difference in modulation between late trials of one block and the early trials of the following one), and the saving (i.e., modulation difference of the early trial of the first block and the early trial of the other blocks). (C) Comparison of mean (±SE) delta, reset and saving in the two groups. Notice that the only significant difference was found for mean savings (asterisk).

