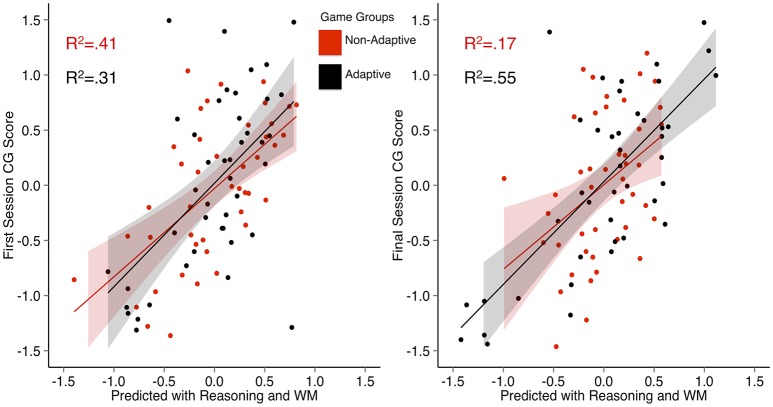
Figure 3.
Multiple regression plots showing the predicted values for first (left) and final (right) session casual game performance for non-adaptive and adaptive group games derived from regression models using WM and reasoning as predictors. R2 = adjusted R2. The shaded area represents the 95% confidence region for each predictor in the model.

