
FIGURE 4.
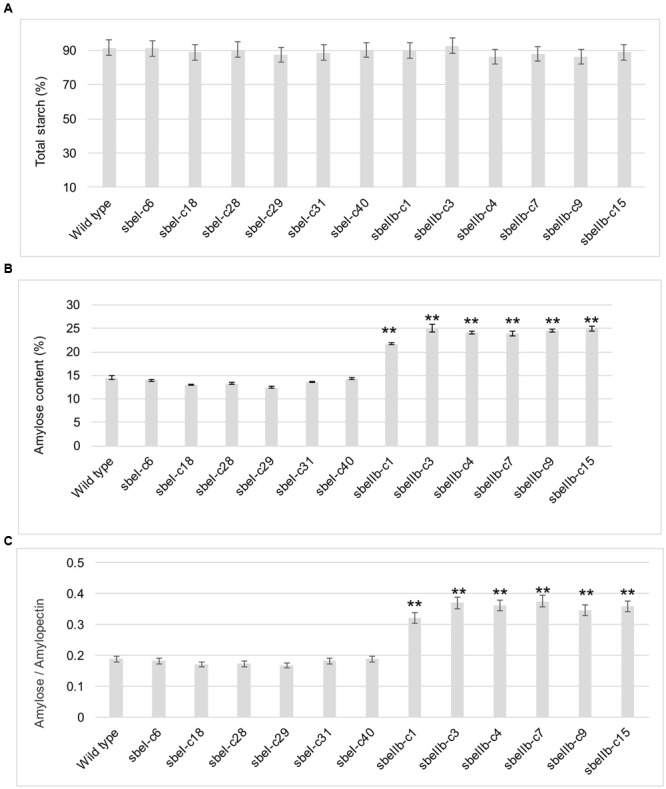
The starch contents of polished grains from different sbeI and sbeIIb mutant lines. (A) Total starch contents of polished grains of different sbeI and sbeIIb mutant lines. (B) Amylose contents (ACs) of polished grains from different mutant lines. (C) Ratios of amylose/amylopectin of the starch in different mutant lines (∗∗Student’s t-test, n = 3, P < 0.01).