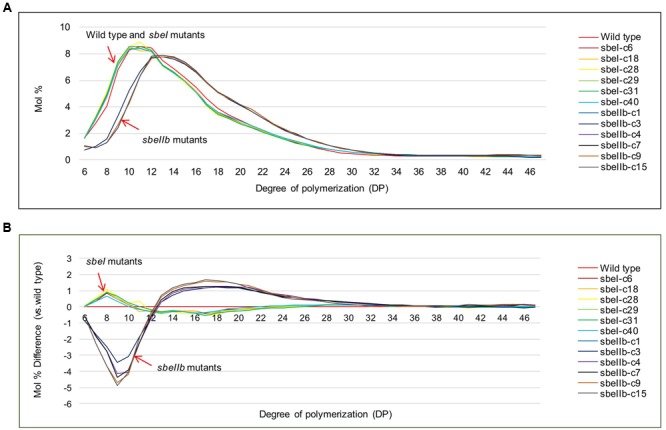
FIGURE 5.

Chain-length distribution profiles of isoamylase debranched starches from different mutant lines. (A) Chain length distribution (CLD) profiles of debranched starch from sbeI and sbeIIb mutant lines compared with wild type. (B) Differences were calculated by subtracting chain-length distributions of isoamylase-debranched wild type from sbeI and sbeIIb mutant lines, respectively.
