Figure 1.
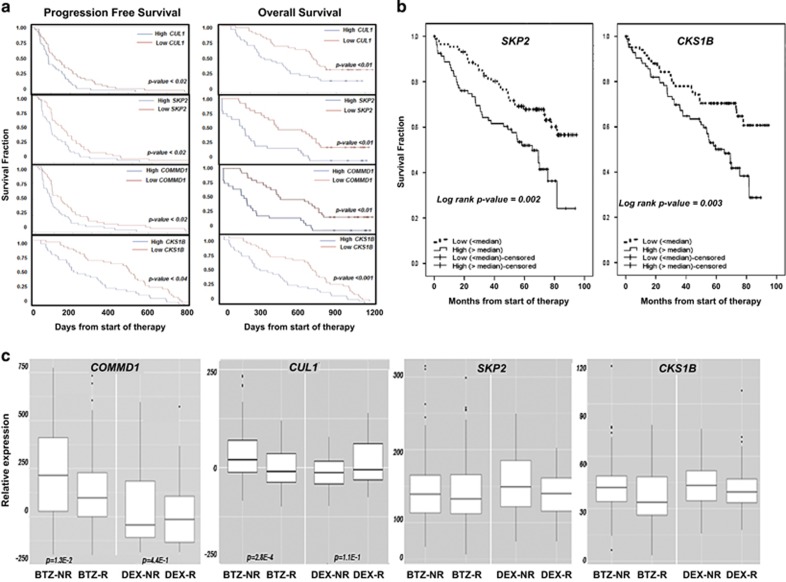
Correlation of the expression of SCFSkp2 components with survival and response to BTZ. (a) Kaplan–Meier PFS curves from MM patients in APEX trial (039) after BTZ treatment (n=163) according to gene expression profile arrays generated at Millenium Pharmaceuticals (Cambridge, MA, USA GSE9782). Probes used were CUL1-207614, SKP2-210567, COMMD1-226024 and CKS1B-201897. PFS was plotted using median values determined for each probe based on data set GSE9782 obtained from analysis of patient samples. Kaplan–Meier OS curves of patients treated with BTZ according to CUL1, SKP2, COMMD1 and CKS1B expression above or below median values (GSE9782) are also shown. (b) Kaplan–Meier OS curves for the expression of either SKP2 or CKS1B based on their expression in patients enrolled in the HOVON65/GMMG-HD4 study (GSE19784). Expression of the following probe sets was evaluated: CKS1B (201897); COMMD1 (226024); CUL1 (207614 and 238509); RBX1 (218117); SKP1 (200711 and 200719); and SKP2 (210567 and 203625). Differences in expression in the response categories were assessed using Kruskal–Wallis analysis to distinguish four categories: complete response/near complete response (CR/nCR); very good partial response (VGPR); partial response (PR); and minimal response (MR) or worse. The number of patients per category for the BTZ arm was 17 (CR/nCR), 55 (VGPR), 63 (PR) and 11 (MR or worse), and for the control arm was 4 (CR/nCR), 16 (VGPR), 66 (PR) and 43 (MR or worse). Survival analysis was performed as described using PFS censored for allogeneic transplant and OS.39 Survival analysis was performed with 169 cases in the BTZ arm and 158 cases in the control arm. (c) Expression of COMMD1, CUL1, SKP2 and CKS1B in tumor cells from patients enrolled in trial 039 that had been treated with BTZ (n=163) or dexamethasone (DEX; n=70). Response to therapy was defined in trial 039 and HOVON-65/GMMG-HD4 using criteria established by the European Group for BMT: http://www.ncbi.nlm.nih.gov/pubmed/9753033?access_num=9753033&link_type=MED&sso-checked=true&dopt=Abstract. Responders were patients that achieved a complete remission (CR), very good partial remission (VGPR), partial remission (PR) or minor remission (MR), and non-responders were those patients that achieved progressive disease (PD), stable disease or minor remission. PD required a 25% increase in paraprotein, whereas MR, PR and CR required at least a 25%, 50% or 100% decrease, respectively. Baseline correction of the original data set was performed to identify individual genes differentially expressed in BTZ-non-responders (NRs) relative to BTZ-responders (Rs). Analysis criteria required at least a fivefold log difference in expression between the NRs and Rs and P-value <0.05. COMMD1 expression difference in BTZ-NRs vs BTZ-Rs was log (fold-change)=151 (P=1.3E-2) and in the DEX-NRs vs DEX-Rs was log (fold-change)=77 (P=4.4E-1). For CUL1, expression difference in BTZ-NRs vs BTZ-Rs was log (fold-change)=32 (P=2.8E-4) and in DEX-NRs vs DEX-Rs the change was log (fold-change)=−21 (P=1.1E-1). Probes used were SKP1-200711, 200718, 200719, 2007974; SKP2-203625, 203626, 210567; CULLIN-1-207614; COMMD1-226024; RBX1-218117; and CKS1B-201897.

