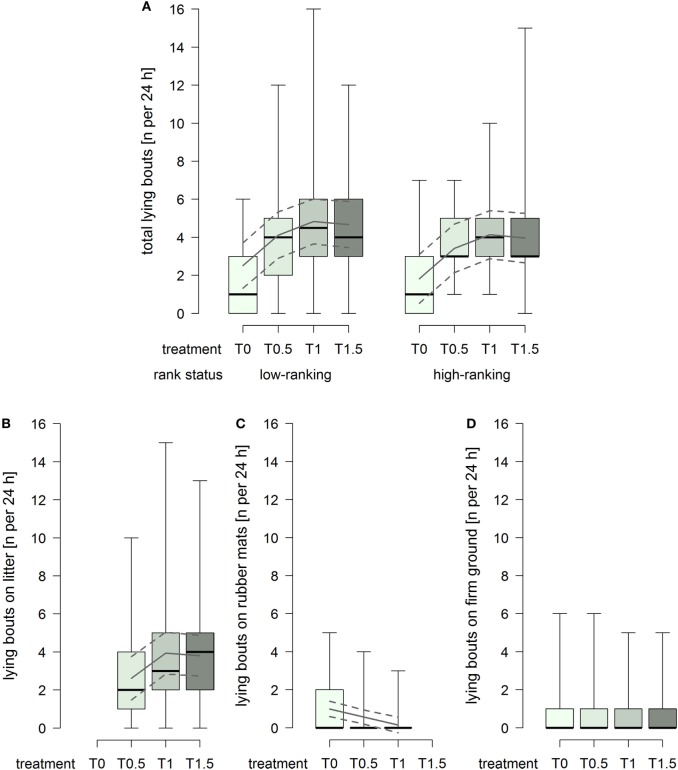
Figure 3.
Number of lying bouts per individual per 24 h in treatments T0, T0.5, T1, and T1.5 for (A) total (recumbency on litter, rubber mats, and firm ground), (B) on litter, (C) on rubber mats, and (D) on firm ground. Boxplots show medians, interquartiles, and absolute ranges of data. In addition, model estimates (solid lines) and 95% confidence intervals (dashed lines) are shown.

