
Fig. 2. Differential IRS-2 protein expression in various tissues of the wild type (Irs-1+/+), heterozygous (Irs-1+/−), and homozygous (Irs-1−/−) mice.
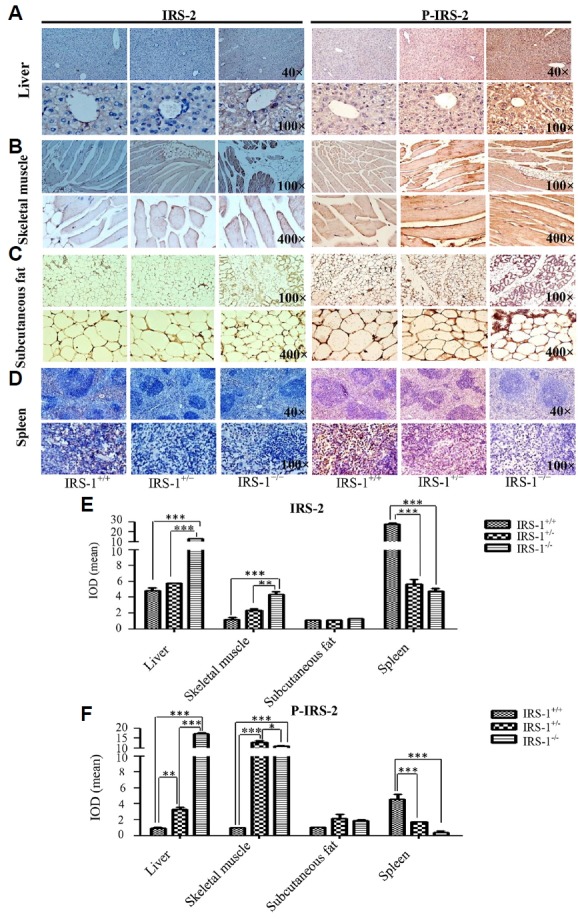
(A–D) In the liver and in the spleen, the figure above was 40 maganification and figure below was 100 maganification. In the skeletal muscle and subcutaneous fat, the figure above was 100 maganification and figure below was 400 maganification. (E–F) With Image Pro-Plus 6.0 software quantitative analyses, in the expression of IRS-2 or p-IRS-2, at least three high definition vision of every group were photoed as the final datas. Thus, in liver and skeletal muscle, the expression of IRS-2 and p-IRS-2 were all statistically elevated in Irs-1−/−mice than in Irs-1+/+ mice. In addition, there were no statistical differences in the expression of subcutaneous fat among the three genotypes mice. Howerer, in the spleen, this expression pattern was completely opposite compared with that observed in liver and skeletal muscle. *P < 0.05,**P < 0.01, ***P < 0.001.