
Fig. 4. MiR-33 targets IRS-2 and regulates and is regulated by insulin signaling pathway.
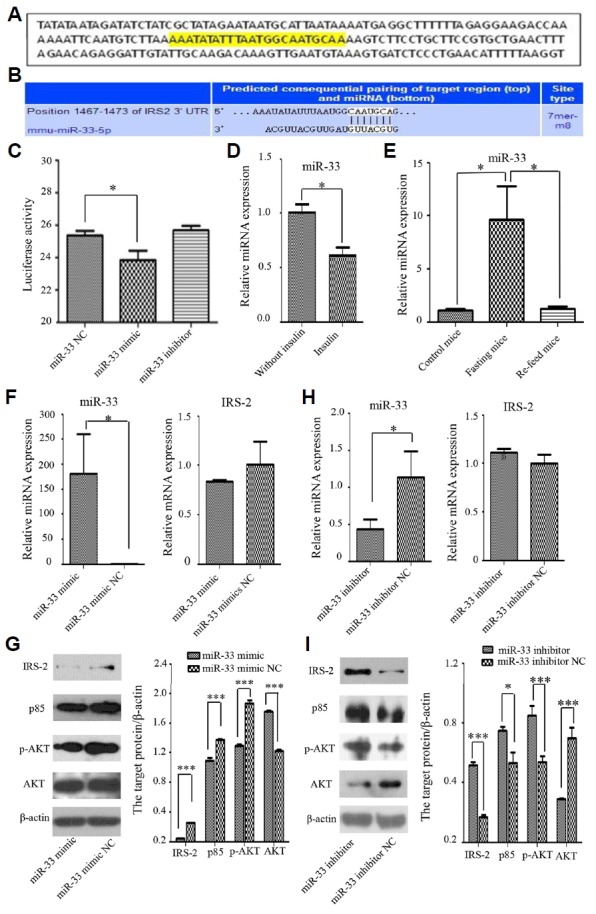
(A) The predicted miR-33 binding site (yellow) in the 3′ UTR of mouse Irs-2 using Targetscan software. (B) Consequential pairing of the Irs-2 3′ UTR region and miR-33. (C) Luciferase reporter gene assay showing activity after transfection with the miR-33 mimic, inhibitor, and negative control (NC). Luciferase activity was significantly reduced in the presence of the miR-33 mimic. (D) The relative expression of miR-33 was significantly down-regulated in the presence of insulin in comparison with absence of insulin. (E) The relative expression of miR-33 was obviously up-regulated in the fasting status in the subcutaneous fat compared with in normal (control) or re-feeding status. (F) The expression of miR-33 was significantly promoted, but the mRNA levels of Irs-2 in primary liver cells transfected with the miR-33 mimic and its NC showed that Irs-2 was no statistical difference in the presence of the miR-33 mimic. (G) Western blot analysis showed that the insulin signaling proteins (IRS-2, p85 and p-AKT) were down-regulated in the presence of the miR-33 mimic. (H) The expression of miR-33 was significantly declined, but the mRNA levels of Irs-2 in primary liver cells transfected with the miR-33 inhibitor and its NC showed that Irs-2 was also no statistical difference in the presence of the miR-33 inhibitor. (I) Western blot showed the insulin signaling proteins (IRS-2, p85 and p-AKT) were increased transfected with the miR-33 inhibitor. *P < 0.05, *** P < 0.001.