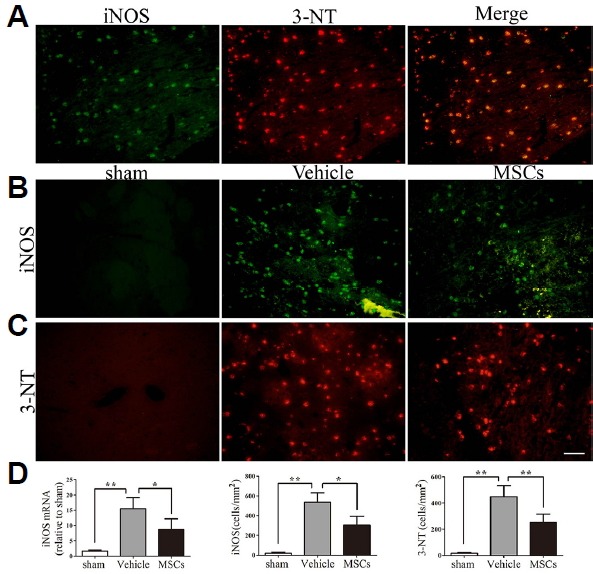
Fig. 5. Effect of MSCs on iNOS and 3-NT expression in the ipsilateral brain hemisphere at 24 hours post-HICH.

(A) In the HICH-vehicle group, enhanced expression of iNOS (green) and 3-NT (red) was detected in the brain hemisphere ipsilateral to the injury. Colocalized expression of iNOS and 3-NT as a yellow-red fluorescence confirms that ONOO− is mainly produced by iNOS. (B) Photomicrographs showed enhanced expression of iNOS (green) in the HICH-vehicle group compared to the HICH-MSC group. The sham group showed very few iNOS positive cells. (C) The more intense red fluorescence in HICH-vehicle sections indicated a higher immunoreactivity for 3-NT compared to sham, while MSC-treated animals had reduced expression of 3-NT relative to HICH-vehicle. (D) Quantification of iNOS and 3-NT levels by PCR (n = 5 per group) and immunofluorescence (n = 4 per group) for the different groups. **p < 0.01; *p < 0.05; Scale bar: 50 μm.
