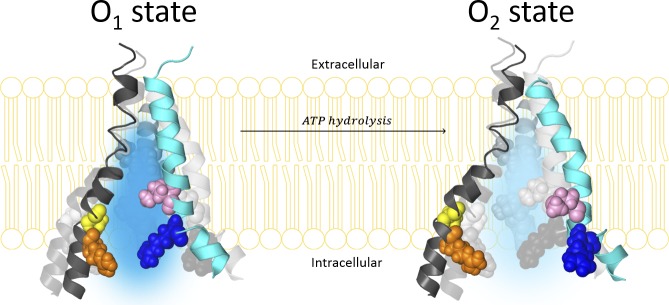
Figure 10.
Hypothetical expansion of the internal vestibule in CFTR’s pore upon ATP hydrolysis-driven O1 to O2 transition. TM6 (cyan), TM5 (black), and TM12 (dark gray) extracted from the homology model proposed by Dalton et al. (2012) are displayed in ribbon and rearranged purely for cosmetic purpose to illustrate a change of dimension in the internal vestibule of CFTR’s pore in a cartoon style. In homology models or the cryo-EM structure of CFTR, the pore-lining TM5 and TM6 are not located at the exact opposite sides of the pore. Also, the depicted expansion of the internal vestibule by no means represents the real molecular motion during the O1 (left) to O2 (right) transition. Pore-lining residues M348, R352, N306, and R303 are labeled in the spherical illustration with the same color code applied in Fig. 4. TM12 (dark gray) extracted from the same homology model is also displayed here along with the pore-lining residues (Bai et al., 2011) in a spherical illustration. From a macroscopic point of view, as the volume of the internal vestibule increases upon transition to the O2 state, the local dielectric constant increases with the space filled with more water molecules. The electric field (both favorable and unfavorable) sensed by MOPS− is expected to dissipate more readily for the O2 state. Differences in the local electric field between the O1 and O2 states subsequently result in different docking kinetic parameters for MOPS− block. To qualitatively depict the local electric field difference between the O1 and O2 states, we chose different densities of the positive electric field as an example (blue shadow of the internal vestibule): the darker the blue, the more positive the electric field. (Details are elaborated in the Discussion and supplemental materials).

