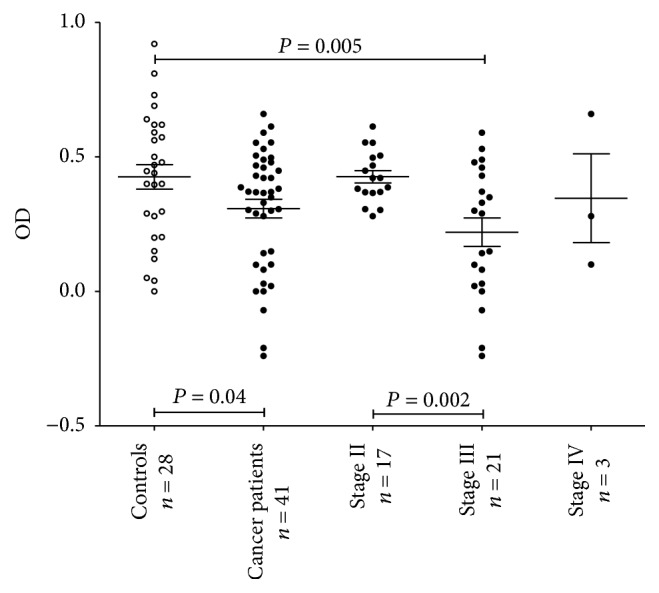
Figure 2.

The level of TF-specific hidden IgG antibodies (HAbs) in controls and cancer patients by stage. Each dot represents one individual and group mean ± SEM is indicated by horizontal lines. The HAb level was calculated as the difference between the levels (OD values) of anti-TF-IgG in tIgG and serum. P values are shown for significant differences.
