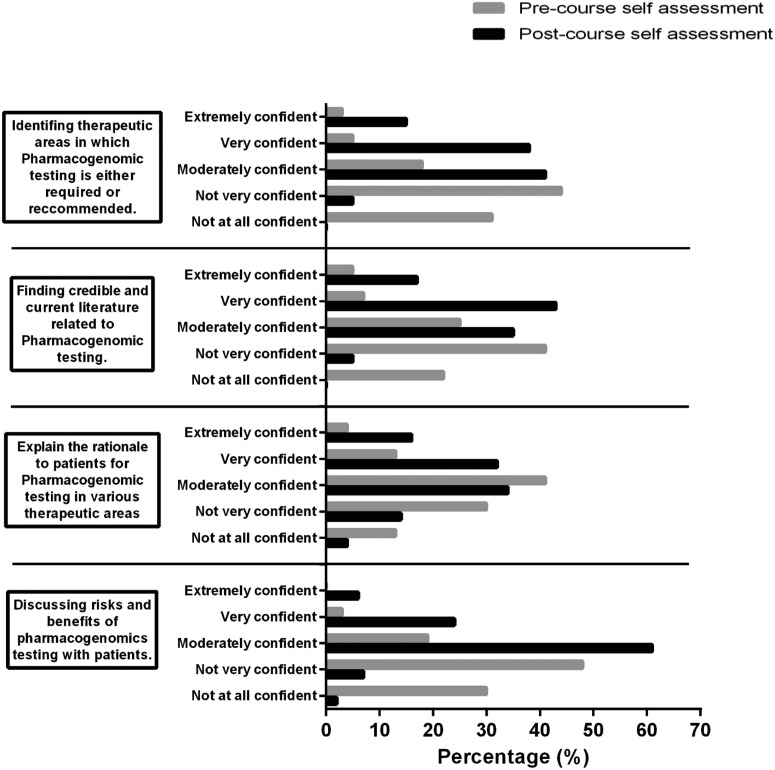
Figure 3.
Histograms of student responses of their confidences to perform various elements of pharmacogenomics testing as assessed through a self-assessment given pre-course and post-course. Gray bars indicate results from the pre-course self-assessment. Black bars indicate results from the post-course self-assessment.

