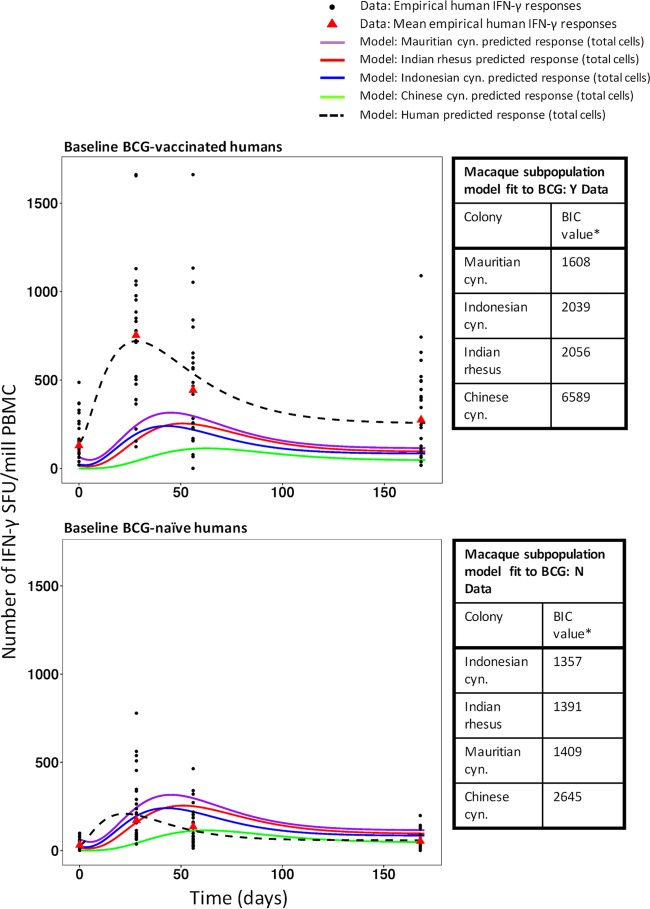
FIG 4.
Mean immune responses of the four macaque colonies and of human subpopulations that were BCG vaccinated (BCG: Y) or BCG naïve (BCG: N) at baseline. Empirical data for human responses are represented by black points (individual data) and red triangles (means). Lines show model predictions. The tables show the results of assessments of the ability of the calibrated macaque colony mathematical model parameters (Table 1, analysis 2) to describe the data for the human BCG: Y and BCG: N subpopulations. Bayesian information criterion (BIC) values are listed in ranked order, from lowest to highest. Asterisks indicate that all differences in BIC values are significant (a BIC value difference of >6 is considered significant [46]). cyn., cynomolgus.

