Figure 3.

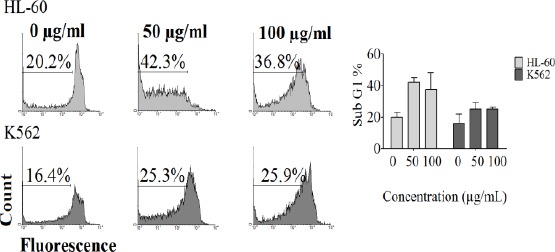
PI staining and flow cytometry analysis of CH2Cl2 extract (0, 25, 50, 100 µg/ml) induced apoptosis in K562 and HL-60 cells

PI staining and flow cytometry analysis of CH2Cl2 extract (0, 25, 50, 100 µg/ml) induced apoptosis in K562 and HL-60 cells