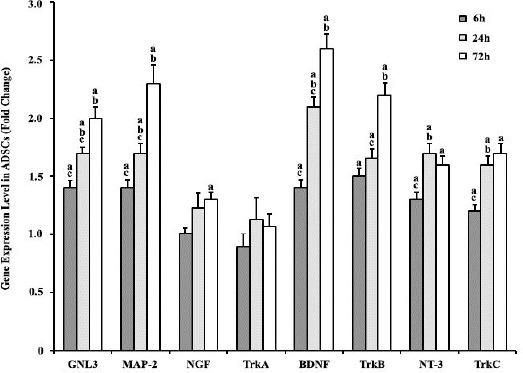
Figure 5.

Real-time PCR analysis of GNL3, MAP-2, NGF, TrkA, BDNF, TrkB, NT-3, and TrkC in ADSCs; 6 hr, 24 hr, and 72 hr after simulated microgravity treatment compared with the 1G group. Gene’s expressions were normalized to endogenous GAPDH in the same samples. The expression of GNL3, MAP-2, BDNF, TrkB, NT-3, and TrkC showed a gradual and significant up-regulation following microgravity treatment. Results represent three independent experiments. P<0.05 considered as significant. (a) Statistically different from the control group, (b) statistically different from the previous time-scale group, and (c) statistically different from the next time-scale group
