FIG. 3.
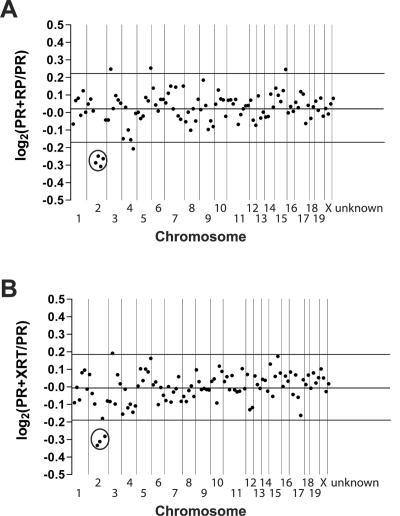
Average expression levels for genes by chromosome in PR+RP and PR+XRT acute promyelocytic leukemia samples relative to PR acute promyelocytic leukemia samples. (A) We mapped 5,491 genes/ESTs to an exact genomic location. The average gene expression level was calculated for 10 PR+RP acute promyelocytic leukemia samples with del(2) and nine PR acute promyelocytic leukemia samples without del(2). A PR+RP/PR acute promyelocytic leukemia sample ratio was generated for each gene/EST. The log2 value of each ratio was calculated, and the log2 ratio for 50 consecutive genes on the same chromosome was averaged to generate one data point. The last data point at the right of the plot represents the average log2 expression ratio for all probe sets unable to be assigned a genomic location (unknown, n = 1,634). (B) We mapped 5,407 genes/ESTs to a genomic location. Each data point represents the average log2 ratio of 50 consecutive genes on a chromosome for 8 PR+XRT acute promyelocytic leukemia samples with del(2) versus nine PR acute promyelocytic leukemia samples without del(2). The last data point at the right of the plot represents the average log2 expression ratio for all probe sets unable to be assigned a genomic location (unknown, n = 1,586). Vertical lines separate chromosomal boundaries. Circles highlight the data points located on the del(2) interval that are expressed at significantly lower levels in PR+RP and PR+XRT acute promyelocytic leukemia samples compared to PR acute promyelocytic leukemia samples.

