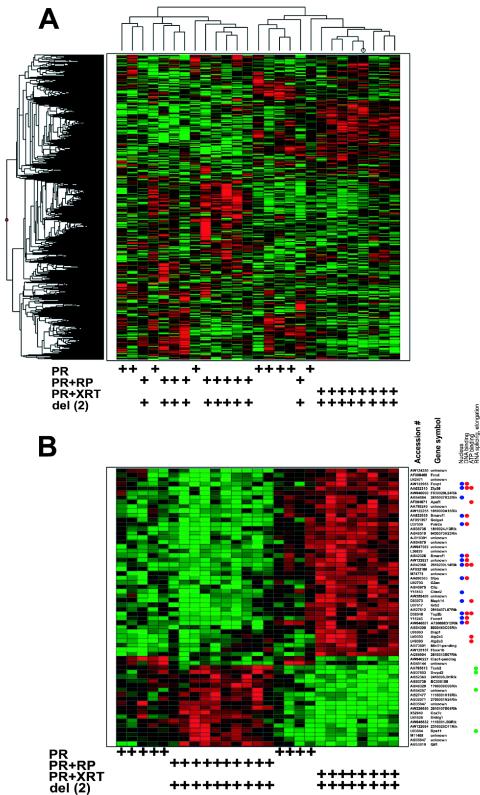
FIG. 6.
Expression profiles of PR, PR+RP, and PR+XRT acute promyelocytic leukemia samples. (A) Unsupervised hierarchical clustering with 7,350 genes/ESTs (rows) and nine PR acute promyelocytic leukemia samples without del(2), 10 PR+RP acute promyelocytic leukemia samples with del(2), and eight PR+XRT acute promyelocytic leukemia samples with del(2) (columns). (B) Heat map generated with 62 genes/ESTs (rows) and 27 samples (columns). Each row represents one gene/EST, and each column represents one sample.

