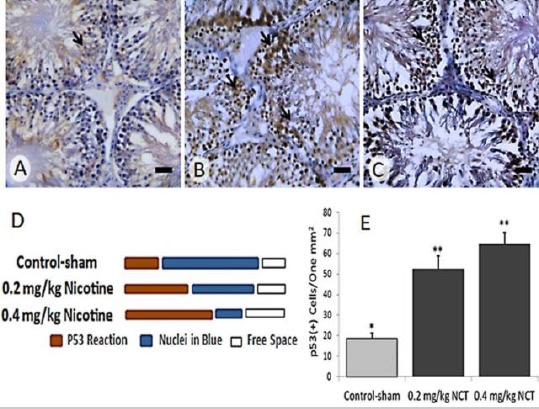
Figure 2.

Immunohistochemical staining for p53 in (A) Control-sham, (B) 0.2 mg/kg nicotine-received and (C) 0.4 mg/kg nicotine-received groups. See increased protein level of p53 (brown chromogen sites, arrows) in nicotine-received groups versus control-sham group, Scale bars: 40 µm. (D) semi-quantitative analyze for p53 reaction as positive pixel diagnosis and (E) quantitative p53-positive cells count per one mm2 of the testicular tissue; All data are represented in mean±SD, *versus **, (P<0.001)
