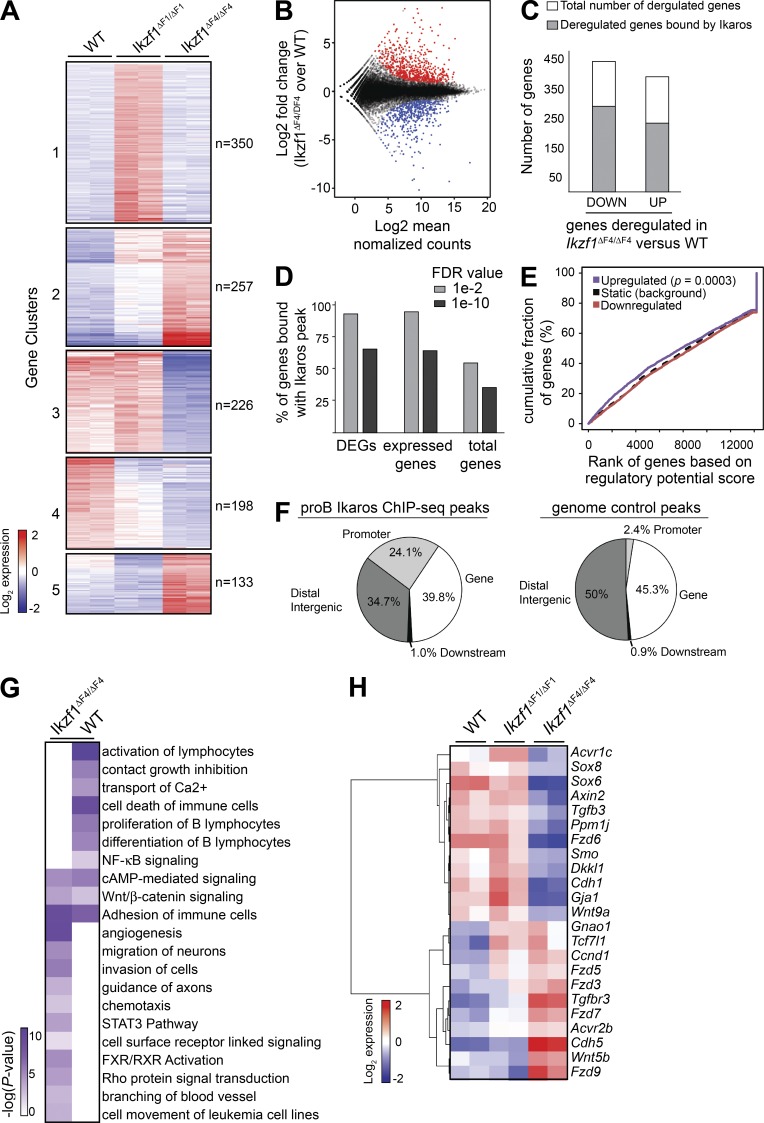
Figure 3.
BCR-ABL1–transformed Ikzf1 mutant cells show distinct sets of deregulated genes and display altered expression of canonical signaling pathways. (A) RNA-Seq libraries were prepared from two biological replicates of day 14 in vitro cultures of BCR-ABL1–transformed WT, Ikzf1ΔF1/ΔF1 and Ikzf1ΔF4/ΔF4 cells from independent experiments. Heat map based on k-means clustering ofdifferentially expressed genes (fold change ≥ 2; P ≤ 0.005) across Ikzf1ΔF1/ΔF1 and Ikzf1ΔF4/ΔF4 compared with WT. (B) MA-plot showing the distribution of differentially expressed genes between Ikzf1ΔF4/ΔF4 and WT. Up-regulated and down-regulated genes in Ikzf1ΔF4/ΔF4 compared with WT samples are indicated in red and blue, respectively. (C) Ikaros ChIP-Seq data from mouse BM-derived progenitor B cells (Bossen et al., 2015) were analyzed and the number of differentially expressed genes with Ikaros binding annotated within 100 kb is displayed in gray, whereas genes without any annotated Ikaros peaks are displayed in white (open) columns. (D) MACS2 peak calling was performed on the Bossen dataset using default (FDR of 1 × 10⁻²) or a stringent cutoff (FDR of 1 × 10⁻¹⁰), resulting in 33,959 or 7,656 peaks, respectively. All genes within 100 kb of a peak were then annotated and the percentage of differentially expressed genes (DEGs) between Ikzf1ΔF4/ΔF4 versus WT cells was determined. The percentage of expressed genes bound by Ikaros was determined by dividing the number of genes bound by Ikaros by the number of genes in our mouse RNA-Seq data that have a mean regularized log normalized count > 5 across all Ikzf1ΔF4/ΔF4 and WT samples. The percentage of total genes bound by Ikaros was determined by dividing the total number of genes bound by Ikaros by the total 34,588 RefSeq genes. (E) Activating/repressive function prediction of Ikaros by ChIP BETA. The purple and the red lines represent the up-regulated and down-regulated genes in Ikzf1ΔF4/ΔF4 (versus WT) cells, respectively. The dashed line indicates the nondifferentially expressed genes as background. Genes are cumulated by the rank on the basis of the regulatory potential score from high to low. P values that represent the significance of the up-regulated (P = 0.000302) or down-regulated (P = 0.983) group distributions are compared with the nondifferentially expressed group by the Kolmogorov-Smirnov test. (F) Relative distribution of Ikaros enrichment peaks of the shared 1,704 pro–B Ikaros peaks (as defined in Fig. S1) or control genomic regions relative to RefSeq gene features. (G) IPA revealed several enriched deregulated pathways. Several representative pathways and biological processes are shown, with –log10 P values in heat map. (H) Heatmap of deregulated genes that fall into the Wnt gene pathway list.

