Figure 3.
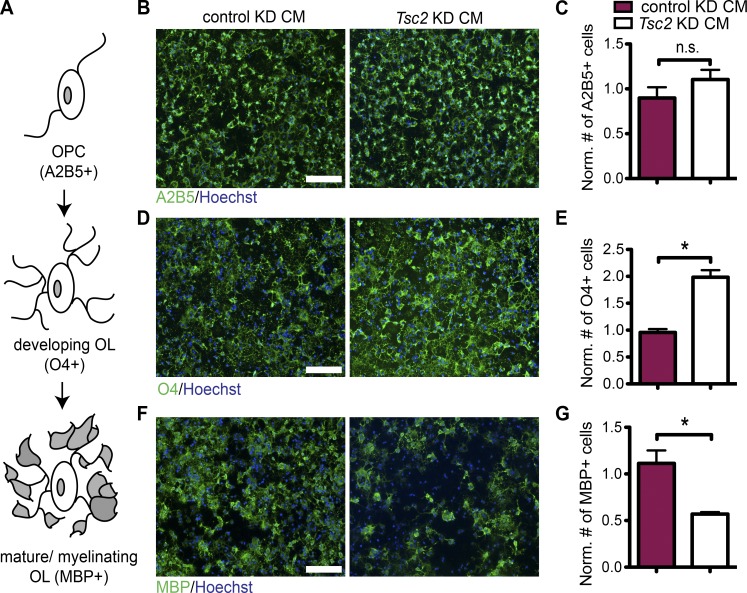
CM collected from Tsc2 KD neurons blocks the maturation of wild-type oligodendrocytes. (A) Schematic cartoon of oligodendrocyte differentiation, showing OPC and developing and mature/myelinating oligodendrocyte (OL) stages. The stage-specific markers are displayed in parentheses. OPCs, which are treated by either control KD CM or Tsc2 KD CM are stained for different stage-specific markers as shown. (B) The cells are stained for A2B5 (green) and Hoechst (blue). (C) The graph shows the quantification of A2B5+ cells. (D) The cells are stained for O4 (green) and Hoechst (blue). (E) The graph shows the quantification of O4+ cells. (F) The cells are stained for MBP (green) and Hoechst (blue). (G) The graph shows the quantification of MBP+ cells. Quantifications of cells normalized (Norm.) to Hoechst+ cells (total cell number) and to the cells treated with CM from noninfected neurons are shown. The error bars represent SEM. *, P < 0.05; Student’s t test. n = 3 independent experiments were performed for all. Bars, 100 µm.

