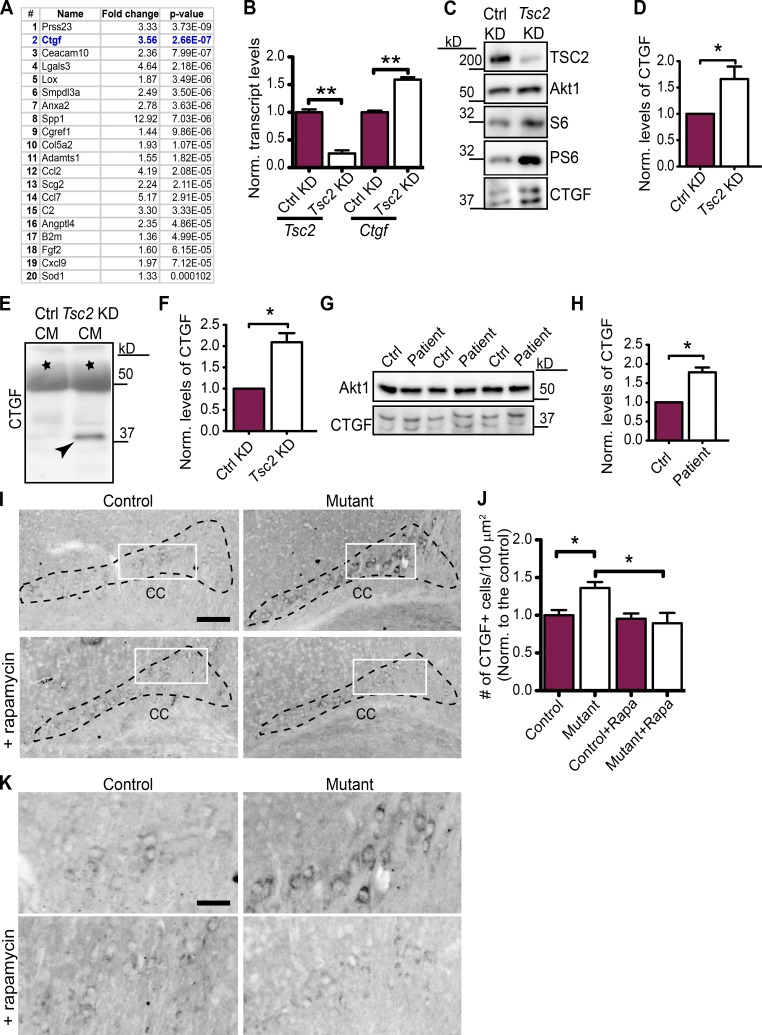
Figure 4.
CTGF is up-regulated in Tsc-deficient neurons. (A) Gene expression profiling from Tsc2 KD primary cortical neurons, displaying the top 20 mRNAs encoding secreted proteins that are up-regulated in order of significance. (B) qRT-PCR of Tsc2 and Ctgf in control (Ctrl) KD and Tsc2 KD primary cortical neurons. n = 3 independent experiments. (C) Immunoblotting of control and Tsc2 KD cortical neurons showing Tsc2, S6, PS6 (activation of mTOR pathway), Akt1 (loading control), and CTGF levels. (D) Quantification of the CTGF protein levels normalized to Akt1. n = 4 independent experiments. (E) Immunoblotting of CTGF (depicted with an arrowhead) secreted in the control and Tsc2 KD CM from cortical neurons. (F) Quantification of the secreted CTGF protein levels normalized to a background band (indicated by black stars in E). n = 3 independent experiments. (G) Immunoblotting of iPSC-derived human neuron lysates from control and TSC patients for Akt1 (loading control) and CTGF. (H) Quantification of the CTGF protein levels normalized to Akt1. n = 3 independent experiments, three different cell line sets from two patient and control pairs. (I) CTGF staining of brain sections from control (Tsc1wwSynICre+; n = 5) and mutant (Tsc1ccSynICre+; n = 6) and rapamycin-treated control (n = 3) and mutant (n = 4) mice at P21. The corpus callosum (CC) is depicted. Bar, 500 µm. (J) Densities of CTGF+ cells are quantified (areas are depicted with black dashed lines in I). n = 5 independent experiments. Rapa, rapamycin. (K) Enlarged images from the white rectangles in I. Bar, 150 µm. The error bars represent SEM. *, P < 0.05; **, P < 0.01; Student’s t test (A, B, D, F, and H) or Bonferroni’s test (J). Norm., normalized.

