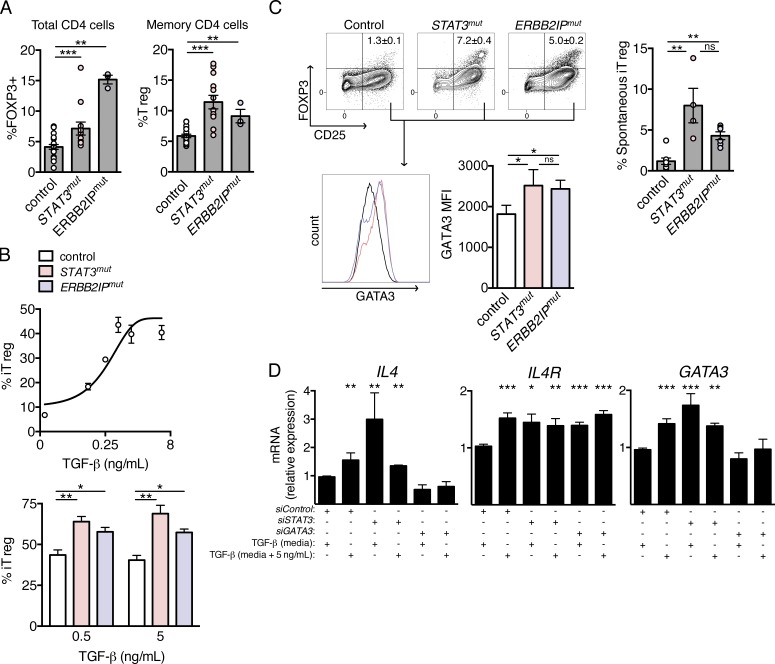
Figure 4.
Increased TGF-β sensitivity in STAT3mut and ERBB2IPmut CD4 lymphocytes is associated with increased T reg cells and induced GATA3 expression in vitro. (A, left) FOXP3 induction in total CD4+ T cells after short-term stimulation of control (n = 20), dominant-negative STAT3-mutant (STAT3mut; n = 13), and ERBIN-mutant (ERBB2IPmut; n = 3) individual cells. (Right) Prevalence of regulatory T cells (T reg) among memory (CD45RO+) cells from control (n = 20), STAT3mut (n = 12), and ERBB2IPmut (n = 3) patients. (B, top) Dose response of inducible regulatory T cells (iT reg) to TGF-β concentration in control naive CD4 lymphocytes in vitro. (Bottom) Percent iT reg cells obtained in cultures of control, STAT3mut, and ERBB2IPmut patient lymphocytes at the indicated concentrations of TGF-β. (C, top) Contour plot of FOXP3 and CD25 expression showing the spontaneous iT reg cell (FOXP3+CD25bright) population obtained after culture of naive CD4 lymphocytes with weak (0.5 µg/ml αCD3) TCR stimulation under nonskewing conditions, in the presence of IL-2. (Right) Combined data. (Bottom) Representative histograms of GATA3 expression among FOXP3−CD25+ cells from these same cultures (left) and combined data (right). (D) Relative quantitation of IL4, IL4R, and GATA3 genes in Jurkat T cells after knockdown of STAT3 (siSTAT3), GATA3 (siGATA3), or scrambled control (siControl) under standard culture conditions (10% FCS, determined to contain 10% of maximal TGF-β activity [media]) or in the presence of exogenous TGF-β (media + 5 ng/ml). Data are representative or combined from at least three independent experiments and are represented as the mean ± SEM. Unpaired two-tailed Student’s t tests and Mann-Whitney tests were used where appropriate. *, P < 0.05; **, P < 0.005; ***, P < 0.001.

