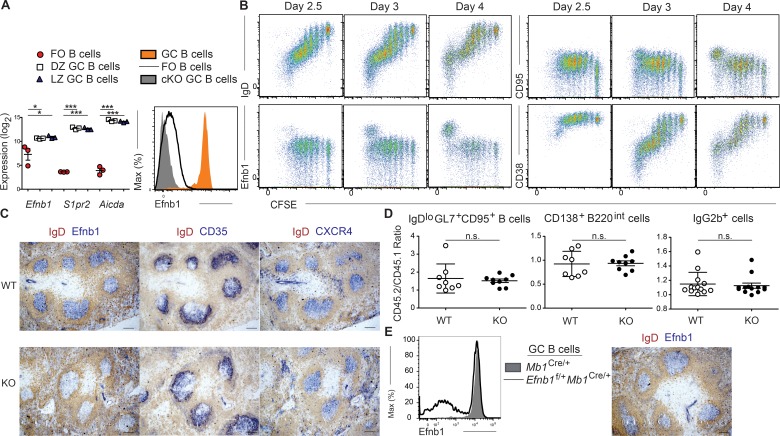
Figure 1.
Ephrin-B1 is highly expressed on GC B cells. (A) Analysis of the expression of Efnb1, S1pr2, and Aicda transcripts in IgD+CD23+GL7–CD95− follicular B cells, CXCR4hi (DZ), and CXCR4lo (LZ) GC B cells, gated as IgDloGL7+CD95+ cells at day 8 after SRBC immunization (left). Expression was determined using an Affymetrix Mouse Genome 430 2.0 Array with data combined from three independent experiments in which each population was sorted from multiple pooled mice. Expression of Ephrin-B1 in Mb1Cre/+ follicular and GC B cells and in Efnb1f/fMb1Cre/+ (cKO) GC B cells at day 12 after SRBC immunization (right). Data are representative of three independent experiments with at least three mice per group. (B) Analysis of Ephrin-B1 up-regulation in antigen-specific B cells. CFSE-labeled lysozyme-specific (MD4) transgenic B cells and OT-II T cells were transferred to mice 1 d before immunization with DEL-OVA. Splenocytes were analyzed at days 2.5, 3, and 4 after immunization, and expression of IgD, CD95, Ephrin-B1, and CD38 was determined as compared with CFSE dilution in the transferred MD4 B cell population. Data are representative of at least two independent experiments at each time point. (C) Representative images of GCs in spleens from Efnb1f/fMb1Cre/+ (KO) and Mb1Cre/+ (WT) mice at day 12 after SRBC immunization. Data are representative of many imaged GCs from at least three mice of each type. All GC clusters in WT mice were Efnb1+. Bar, 50 µm. (D) Analysis of the GC response in mice in which CD45.2+ Efnb1f/fMb1Cre/+ or Mb1Cre/+ Hy10 cells were transferred, along with CD45.1+ wild-type Hy10 cells and OT-II T cells, 1 d before immunization with DEL-OVA. GC B cells were defined as IgDloGL7+CD95+ cells. Data are pooled from three independent experiments with two to three mice per group analyzed at day 7 after immunization. No statistical differences were found between groups. (E) Representative histogram of Ephrin-B1 expression in GC B cells from female Efnb1f/+Mb1Cre/+, and Mb1Cre/+ mice at day 12 after SRBC immunization (left). Representative Efnb1 staining in an Efnb1f/+Mb1Cre/+ mouse spleen (right). Data are representative of at least two mice of each type. Bar, 50 µm. Statistical analyses were performed using the unpaired two-tailed Student’s t test (*, P < 0.05; **, P < 0.01; ***, P < 0.001).

