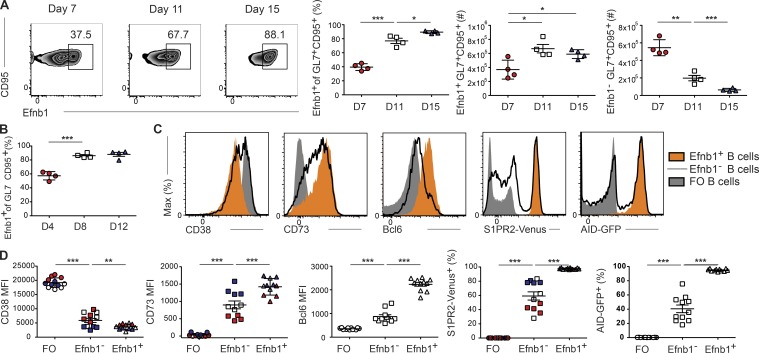
Figure 2.
Ephrin-B1 marks mature GC B cells. (A) Representative FACS plots of Ephrin-B1 expression (left) and percentages and numbers of Efnb1+ and Efnb1– (right) splenic IgDloGL7+CD95+ B cells at days 7, 11, and 15 after LCMV Arm infection. (B) Percentage of Efnb1+ splenic IgDloGL7+CD95+ B cells at days 4, 8, and 12 after SRBC immunization. (C and D) Histograms (C) and plots of mean fluorescence intensity (MFI; D) of CD38, CD73, Bcl6, S1pr2 (as defined using S1pr2Venus/+ mice), and Aicda (as defined using AID-GFP mice) expression in follicular (IgD+GL7–) and Efnb1+ and Efnb1– IgDloGL7+CD95+ B cells. Data are from day 7 (red), 11 (white), and 15 (dark blue) after LCMV Arm infection. Data for the CD38, CD73, and S1pr2 plots are from one experiment with three to four mice per time point at days 7, 11, and 15 and are representative of two independent experiments at days 7 and 15, and four experiments at day 11. Data for the Bcl6 and Aicda plots are pooled from three independent experiments with 3–4 mice per group at day 11 after infection. Statistical analyses were performed using the unpaired two-tailed Student’s t test (*, P < 0.05; **, P < 0.01; ***, P < 0.001).

