Figure 1.
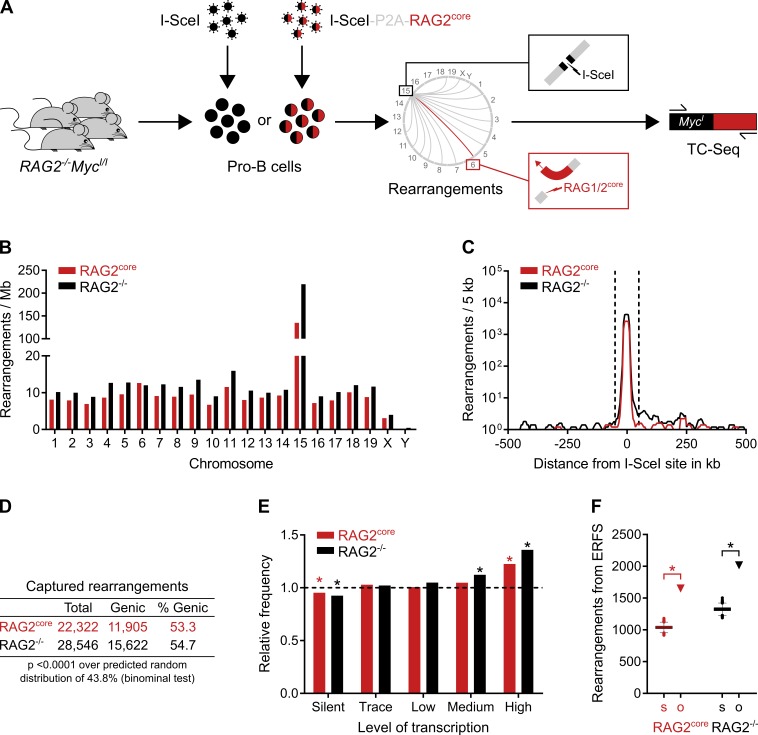
Landscape of chromosomal rearrangements in primary pro–B cells by TC-Seq. (A) Detection of RAG1/2core-induced chromosomal rearrangements by TC-Seq. Primary RAG2−/−MycI/I pro–B cells were infected ex vivo with retroviruses that express either I-SceI alone (RAG2−/− TC-Seq libraries) or I-SceI together with murine RAG2core (RAG2core TC-Seq libraries) by using a “self-cleaving” P2A peptide. DNA breaks, such as those induced by RAG1/2core at Igκ on chromosome 6 (red lightning), rearrange to the I-SceI break at c-myc on chromosome 15 (black lightning) and are subsequently amplified by PCR, deep-sequenced, and analyzed computationally. RAG2core and RAG2−/− TC-Seq libraries were prepared in independent duplicates from infected pro–B cells of 180 mice. (B) Chromosomal distribution of rearrangements. Events were normalized per megabase to account for different chromosome sizes. (C) Profile of rearrangements around the I-SceI site in 5-kb intervals. Dashed lines indicate the ±50-kb region excluded from the analysis for D–F because of saturation. (D) Proportion of genic rearrangements. (E) Frequency of rearrangements derived from differentially transcribed genes compared with a random model (dashed line). Asterisks indicate values significantly different from random (P < 0.01, binominal test). (F) Observed number of rearrangements (o, triangle) originating from ERFSs compared with the random Monte Carlo simulation (s, Tukey boxplot). Asterisks indicate significant enrichment (P < 0.0001, binominal test). For D–F, events from the saturated I-SceI region, cryptic I-SceI sites, and other portions of the genome were excluded (see Materials and methods). Data analysis was performed with pooled RAG2core and RAG2−/− TC-Seq libraries (two independent experiments each). See also Fig. S1 (A and B).

