Figure 5.
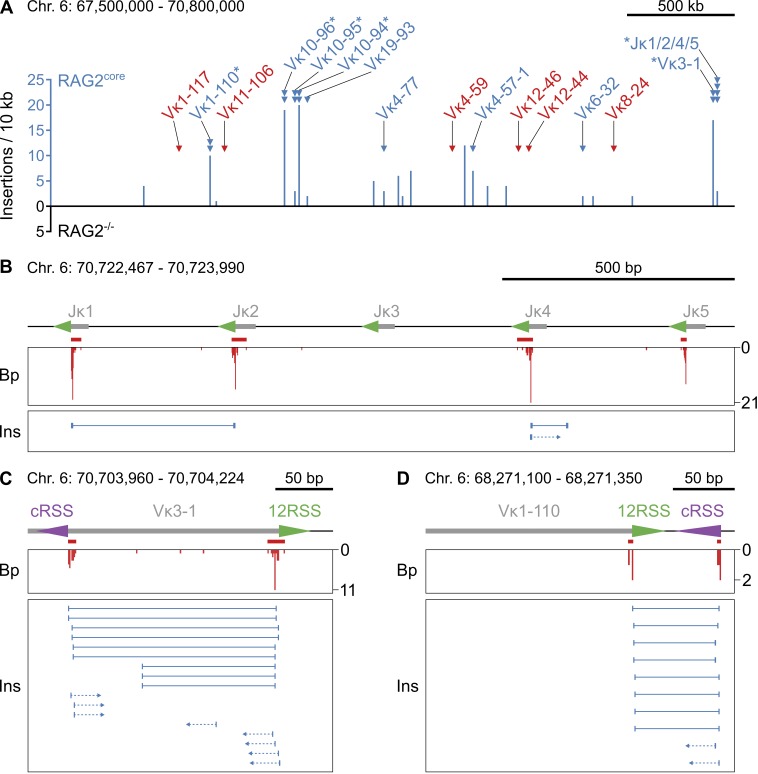
Insertions of RAG1/2core-mobilized DNA into the I-SceI site. (A) Overview of insertions originating from the Igκ locus on chromosome 6. Histogram of the number of insertions derived from each site in the presence or absence of RAG2core (blue and black, respectively) in 10-kb intervals. RAG1/2core-dependent rearrangement breakpoint clusters at Jκs and Vκs (triangles, same as in Fig. 2 A) are color coded to indicate whether insertions from these sites are detected (blue) or not (red). Asterisks mark breakpoint clusters with biased rearrangements (see Fig. 2 [B–D]). No insertions from Igκ were detected in RAG2−/− cells. Chromosome coordinates and scale bar are indicated on top. (B–D) Examples of insertions derived from RAG1/2core-dependent breakpoint clusters at Jκs and Vκs. On top is a diagram of the region, with gray boxes representing Ig segments, triangles indicating 12/23RSSs (green) or cRSSs (purple), and red bars indicating the breakpoint clusters (same as in Fig. 2 [B–D]). In the middle is a histogram showing the number and position of breakpoints (Bp, red). At the bottom, each horizontal line indicates a unique insertion (Ins), with its breakpoints represented by the vertical lines at the ends. Arrows represent insertions for which only one of the two breakpoints could be identified. Chromosome coordinates and scale bar are indicated on top. Data analysis was performed with pooled RAG2core and RAG2−/− TC-Seq libraries (two independent experiments each). See also Table S3.

