Figure 7.
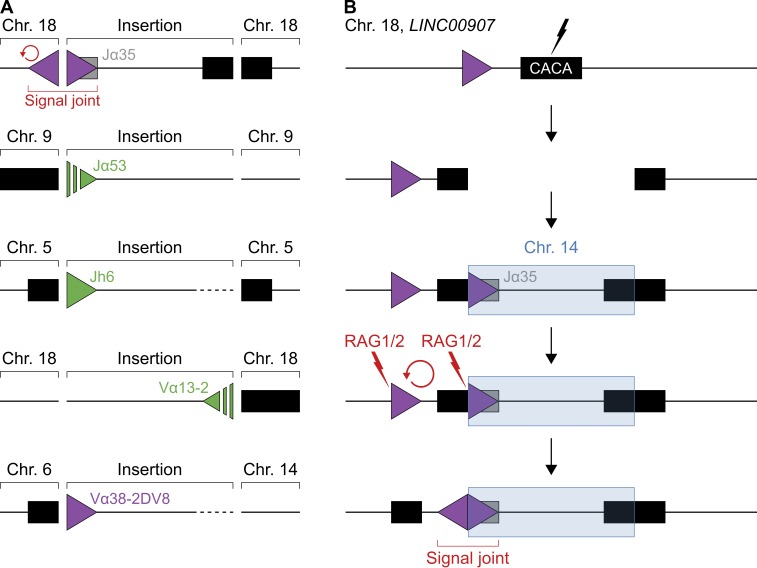
RAG1/2-induced insertions at physiological DNA breaks in vivo. (A) Diagram representing IG/TCR insertions detected in human cancer. From top to bottom: hypodiploid ALL (first), early T cell precursor ALL (second and third), and FL (fourth and fifth). Boxes indicate IG/TCR segments (gray) or repeat regions (black), and triangles represent 12/23RSSs (green) or cRSSs (purple). Inserted gene segments and RSSs/cRSSs are labeled with their corresponding IG/TCR segment of origin. Unresolved junctions are indicated by dashed lines/triangles. The insertion detected in hypodiploid ALL (top) is flanked by an upstream inversion (red arrow), forming a putative cRSS/cRSS signal joint. One of the insertions in FL (bottom) occurred at a translocation junction. Whole-genome sequences from 34 cancer patients were analyzed. (B) Diagram illustrating a putative RAG1/2-mediated DNA inversion caused by the insertion of a cRSS. Boxes represent IG segments (gray) or repeat regions (black), triangles indicate cRSSs (purple), and lightning indicates DNA cleavage induced by RAG1/2 (red) or unknown factors (black). From top to bottom: first, DNA is damaged at a simple CA-repeat region within LINC00907 on chromosome 18. Second, the locus is opened at the break. Third, RAG1/2 excises a DNA fragment containing a cRSS from the TCRα locus on chromosome 14, which subsequently reinserts into the break (blue). Fourth, RAG1/2 cleaves and inverts DNA between the cRSS in the insert and a cRSS near the insertion site (red arrow). Finally, the DNA inversion generates a putative cRSS/cRSS signal joint as observed in A (top). See also Fig. S3 and Table S4.

