Figure 1.
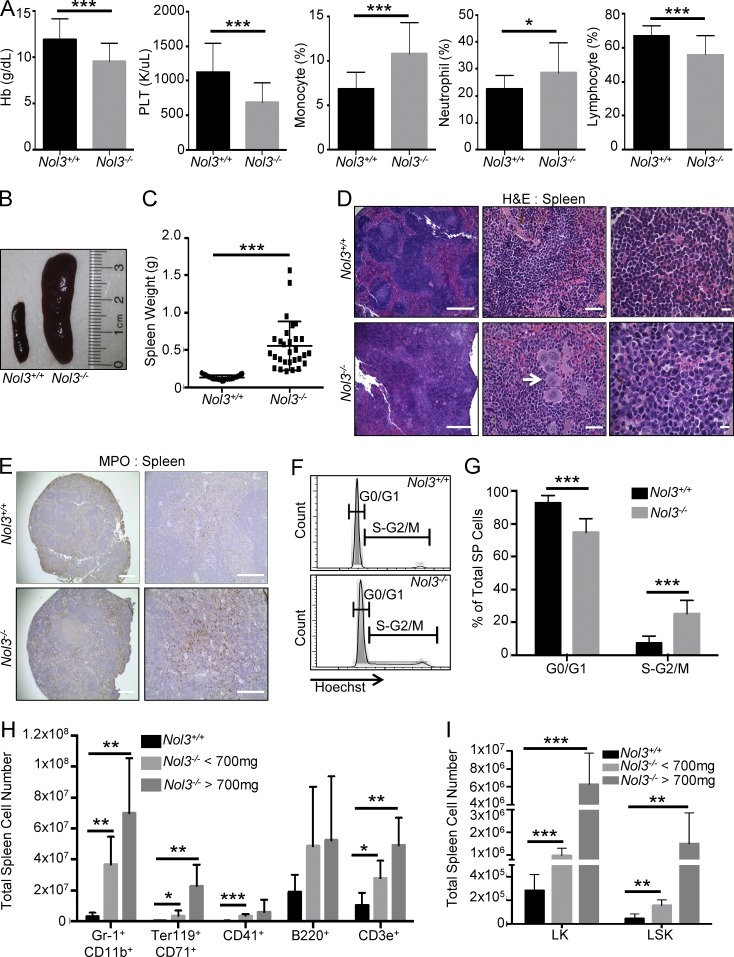
Nol3 deletion leads to peripheral cytopenias and extramedullary hematopoiesis. (A) Hemoglobin (Hb), platelet count (PLT), monocyte, neutrophil, and lymphocyte percentage in the peripheral blood of Nol3+/+ and Nol3−/− mice (Nol3+/+, n = 20; Nol3−/−, n = 25). (B) Representative images of spleens from Nol3+/+ and Nol3−/− mice. (C) Spleen weights of Nol3+/+ and Nol3−/− mice (Nol3+/+, n = 23; Nol3−/−, n = 29). (D) H&E staining of Nol3+/+ and Nol3−/− spleens. White arrow highlights megakaryocyte clustering in Nol3−/− spleens. Bars: (left) 400 µm; (middle) 80 µm; (right) 10 µm. (E) Representative images of myeloperoxidase staining of Nol3+/+ and Nol3−/− spleens. Bars: (left) 1,000 µm; (right) 200 µm. (F and G) Representative histogram plots and quantification of Hoechst-stained spleen cells for cell cycle analysis of Nol3+/+ and Nol3−/− spleens (Nol3+/+, n = 7; Nol3−/−, n = 5). (H) Total cell numbers of mature cells of different lineages in Nol3+/+ and Nol3−/− spleens (Nol3+/+, n = 6; Nol3−/− < 700 mg, spleen, n = 5; Nol3−/− > 700 mg, spleen, n = 3). (I) Total cell numbers of LK and LSK cells in Nol3+/+ and Nol3−/− spleens (Nol3+/+ n = 7, Nol3−/− < 700 mg spleen weight n = 4, Nol3−/− > 700 mg spleen weight n = 2). Bars represent mean values. Error bars represent ±SD; *, P < 0.05; **, P < 0.01; ***, P < 0.001.

