Figure 2.
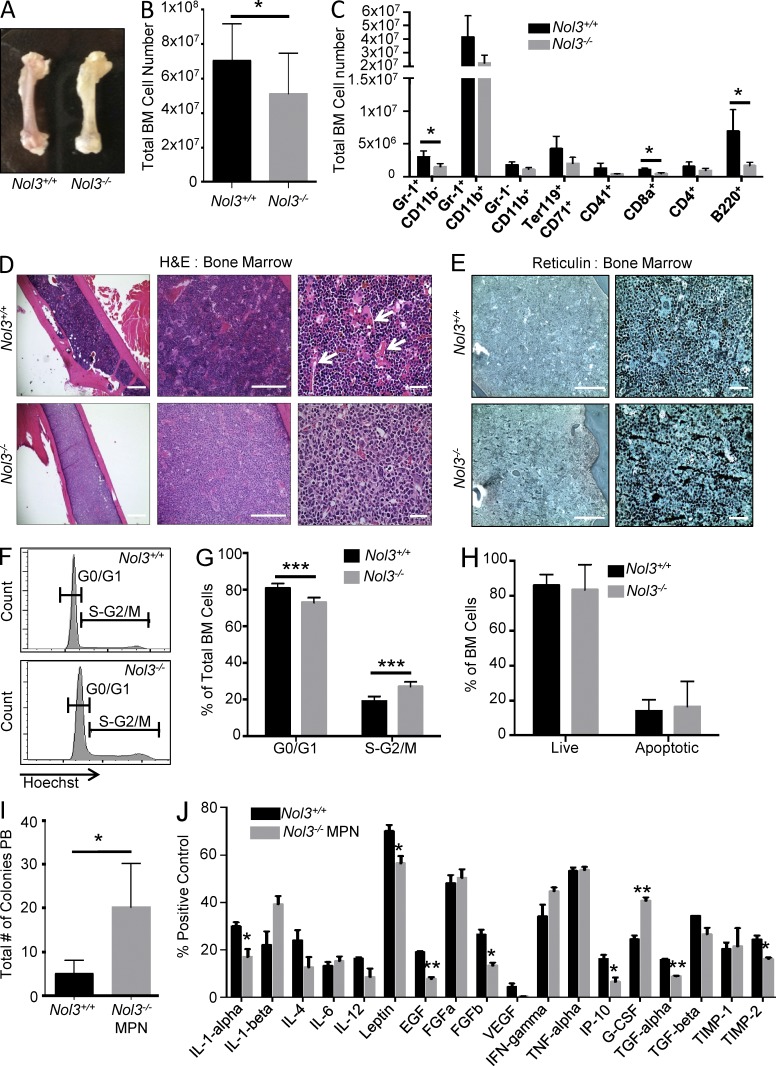
Increased proliferation and myelofibrosis in Nol3−/− bone marrow. (A) Representative femurs from Nol3+/+ and Nol3−/− mice. (B) Total number of cells in Nol3+/+ and Nol3−/− bone marrow (Nol3+/+, n = 17; Nol3−/−, n = 10). (C) Absolute number of mature cell types in Nol3+/+ and Nol3−/− bone marrow (Nol3+/+, n = 4; Nol3−/−, n = 5). (D) H&E staining of Nol3+/+ and Nol3−/− bone marrow sections. Arrows highlight blood sinusoids present in Nol3+/+ femurs. Bars: (left) 1,000 µm; (middle) 200 µm; (right) 80 µm. (E) Reticulin staining of Nol3+/+ and Nol3−/− bone marrow sections. Bars: (left) 200 µm; (right) 80 µm. (F and G) Representative histogram plots and quantification of Hoechst stained bone marrow cells for cell cycle analysis of Nol3+/+ and Nol3−/− bone marrow (Nol3+/+, n = 7; Nol3−/−, n = 5). (H) Percentage of live and apoptotic cells in the bone marrow of Nol3+/+ and Nol3−/− mice measured by Annexin V and DAPI staining (n = 6). (I) Peripheral blood colony assay of Nol3+/+ and Nol3−/− MPN mice (Nol3+/+, n = 5; Nol3−/− MPN, n = 4). (J) Cytokine measurements from pooled serum samples of Nol3+/+ or Nol3−/− mice (n = 6). Bars represent mean values. Error bars represent ±SD; *, P < 0.05; **, P < 0.01; ***, P < 0.001.

