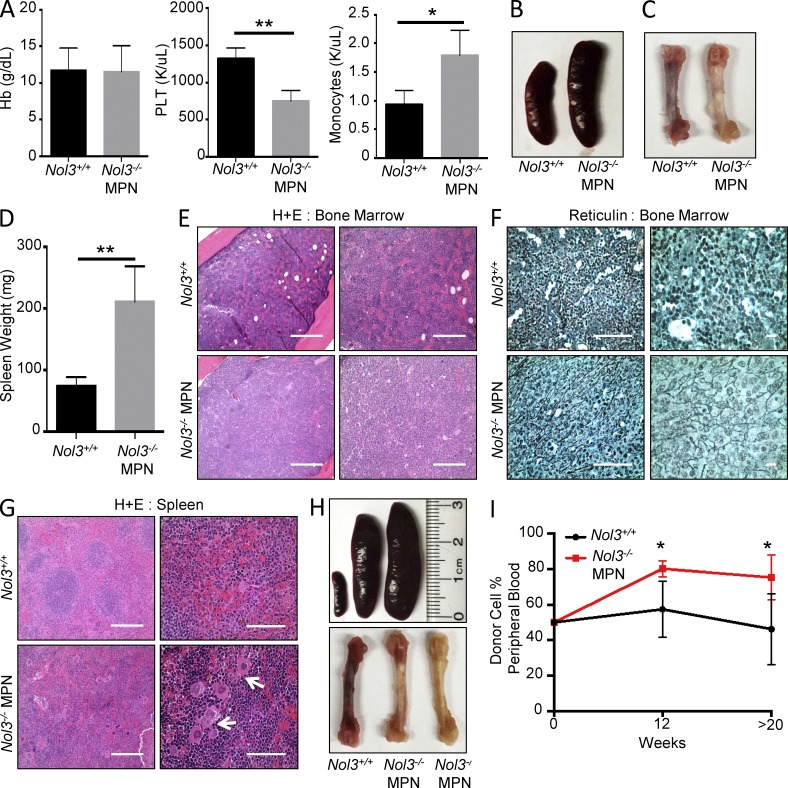
Figure 3.
Nol3−/−-induced MPN is cell intrinsic and transplantable into congenic recipients. (A) Peripheral blood counts of mice transplanted with either Nol3+/+ or Nol3−/− MPN whole bone marrow cells. Hemoglobin (Hb), platelet (PLT), and monocyte counts are shown (n = 4). (B and C) Representative spleen and bone marrow images of recipient mice after transplantation with Nol3+/+ or Nol3−/− MPN total bone marrow cells. (D) Spleen weight of mice transplanted with either Nol3+/+ or Nol3−/− MPN cells (n = 4). (E) Representative H&E of bone marrow sections from congenic recipient mice after transplantation with Nol3+/+ or Nol3−/− MPN whole bone marrow cells. Bars: (left) 400 µm; (right) 200 µm. (F) Representative reticulin staining of bone marrow sections from congenic recipient mice after transplantation with Nol3+/+ or Nol3−/− MPN whole bone marrow cells. Bars: (left) 80 µm; (right) 10 µm. (G) Representative H&E staining of spleen sections from congenic recipient mice after transplantation with Nol3+/+ or Nol3−/− MPN cells. White arrows highlight megakaryocyte clustering in mice transplanted with Nol3-deficient cells. Bars: (left) 200 µm; (right) 80 µm. (H) Images of spleen and femoral bones of congenic recipient mice after transplantation with Nol3+/+ and Nol3−/− MPN total spleen cells. (I) Percentage of peripheral blood donor cell engraftment at 12 and >20 wk after competitive transplantation of either Nol3+/+ or Nol3−/− cells with wild-type competitor cells (Nol3+/+, n = 6; Nol3−/− MPN, n = 5). Bars represent mean values. Error bars represent ±SD; *, P < 0.05; **, P < 0.01.

