Figure 5.
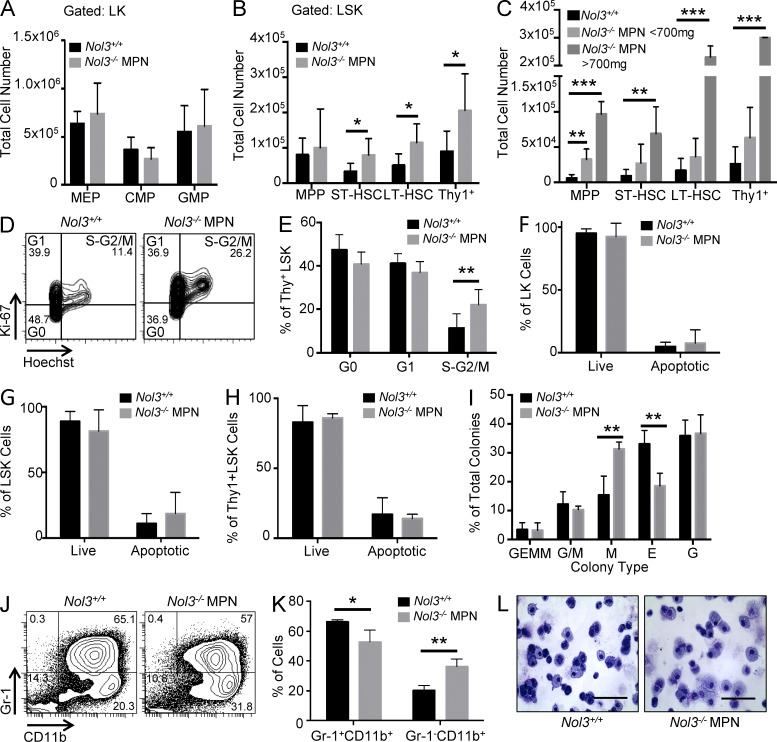
Expanded Thy1+LSK cells exhibit increased cycling and myeloid differentiation bias in Nol3−/− MPN. (A) Absolute numbers of MEP, CMP, and GMP cells in bone marrow of Nol3+/+ and Nol3−/− MPN mice (Nol3+/+, n = 7; Nol3−/− MPN, n = 6). (B) Absolute numbers of MPP, ST-HSC, LT-HSC, and Thy1+LSK cells in bone marrow of Nol3+/+ and Nol3−/− MPN mice (Nol3+/+, n = 7; Nol3−/− MPN, n = 6). (C) Total cell number of MPP, ST-HSC, LT-HSC, and Thy1+LSK in spleens of Nol3+/+ and Nol3−/− MPN mice (Nol3+/+, n = 7; Nol3−/− MPN < 700 mg, spleen, n = 4; Nol3−/− MPN > 700 mg, spleen, n = 2). (D and E) Representative FACS plots and quantification of the cell cycle status of Nol3+/+ and Nol3−/− MPN Thy1+LSK bone marrow cells based on Ki-67 and Hoechst staining (Nol3+/+, n = 7; Nol3−/− MPN, n = 8). (F–H) Percentage of live and apoptotic cells in bone marrow LK, LSK, and Thy1+LSK cells, respectively, from Nol3+/+ and Nol3−/− MPN mice measured by Annexin V and DAPI staining (n = 3). (I) Colony-forming capacity of sorted Nol3+/+ and Nol3−/− MPN Thy1+LSK (Nol3+/+, n = 6; Nol3−/− MPN, n = 3). (J) Representative FACS plots of Gr-1 and CD11b staining of colonies derived from Nol3+/+ and Nol3−/− MPN cells. (K) Percentage of Gr-1+CD11+ and Gr-1−CD11b+ cells after colony formation assay of Nol3+/+ and Nol3−/− MPN cells (n = 3). (L) Wright-Giemsa staining of cytospun cells after colony assay of Nol3+/+ and Nol3−/− MPN Thy1+LSK cells. Bars, 80 µm. Bars represent mean values. Error bars represent ±SD; *, P < 0.05; **, P < 0.01; ***, P < 0.001.

