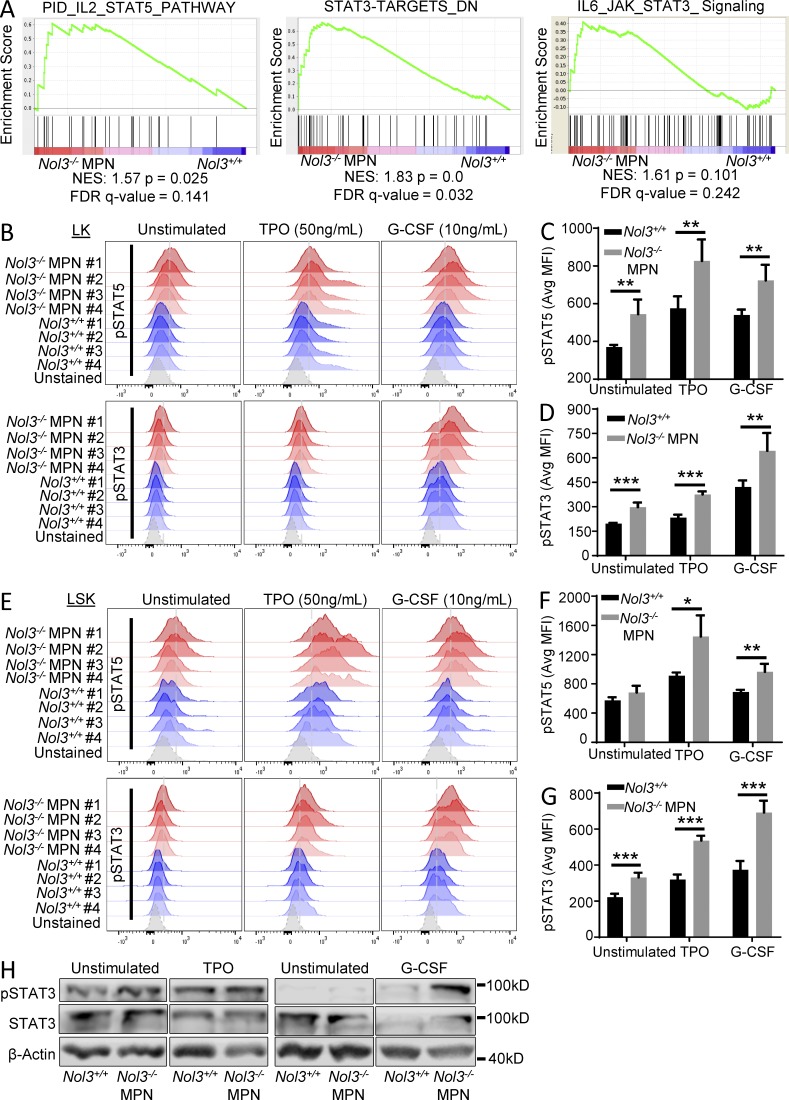
Figure 6.
Nol3-deficient stem and progenitor cells show increased JAK–STAT activation. (A) GSEA of pathways enriched in Nol3−/− MPN Thy1+LSK cells compared with Nol3+/+ Thy1+LSK cells. (B) Phospho-flow analysis of pSTAT5 and pSTAT3 in LK cells of Nol3+/+ and Nol3−/− MPN mice, under unstimulated, TPO-stimulated (50 ng/ml), and G-CSF–stimulated (10 ng/ml) conditions (n = 4). (C and D) Quantification of phospho-flow analysis of pSTAT5 and pSTAT3, respectively, in LK cells from Nol3+/+ and Nol3−/− MPN mice (MFI, mean fluorescence intensity; n = 4). (E) Phospho-flow analysis of pSTAT5 and pSTAT3 in LSK cells of Nol3+/+ and Nol3−/− MPN mice, under unstimulated, TPO-stimulated (50 ng/ml), and G-CSF–stimulated (10 ng/ml) conditions (n = 4). (F and G) Quantification of phospho-flow analysis of pSTAT5 and pSTAT3, respectively, in LSK cells from Nol3+/+ and Nol3−/− MPN mice (MFI, mean fluorescence intensity; n = 4). (H) Western blot analysis of total spleen cells from Nol3+/+ and Nol3−/− MPN mice, under unstimulated, TPO-stimulated (50 ng/ml), G-CSF–stimulated (10 ng/ml) conditions (TPO, n = 3; G-CSF, n = 2). Bars represent mean values. Error bars represent ±SD; *, P < 0.05; **, P < 0.01; ***, P < 0.001.

