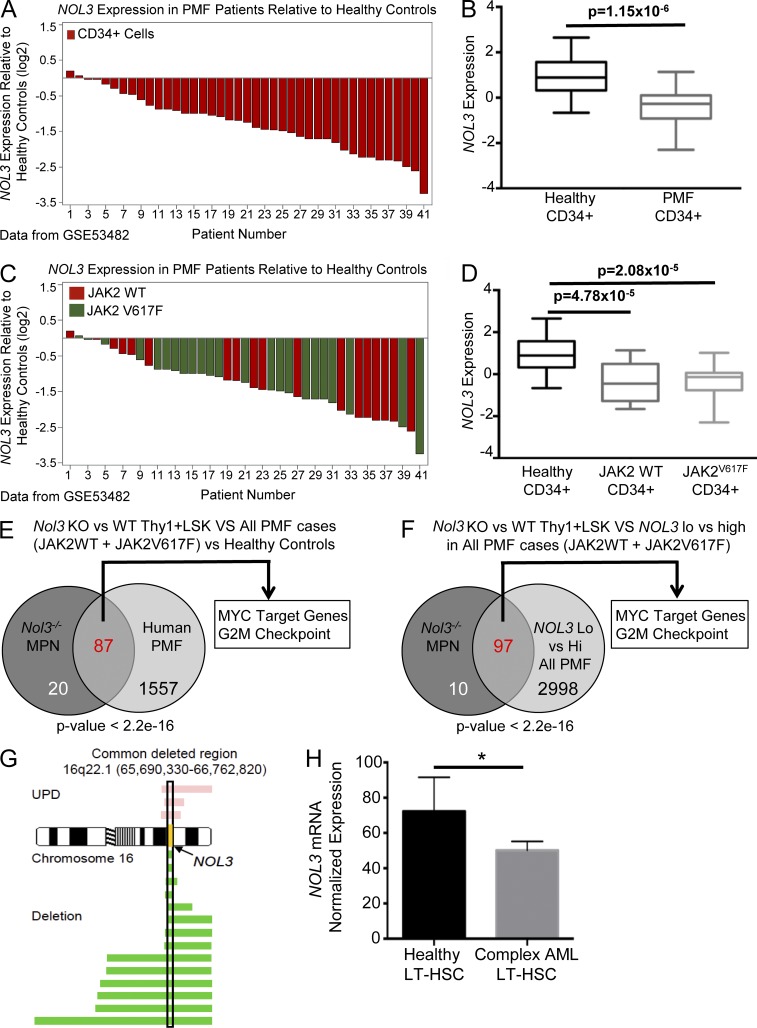
Figure 9.
Nol3-deficient Thy1+LSK cells have a molecular phenotype similar to human PMF, and NOL3 is deleted and down-regulated in patients with myeloid malignancies. (A) Waterfall plot of NOL3 expression in CD34+ cells from 41 patients with PMF relative to the mean expression of NOL3 in CD34+ cells from 16 healthy controls (GEO accession no. GSE53482). (B) Box plot summary of NOL3 expression in CD34+ cells from patients with PMF in comparison to CD34+ cells from healthy controls (GSE53482). (C) Waterfall plot of relative expression of NOL3 in CD34+ cells from 41 patients with PMF (same data as in A) with indicated JAK2V617F mutation status relative to the mean expression of NOL3 in CD34+ cells from 16 healthy controls (GSE53482). (D) Box plot summary of NOL3 expression in CD34+ cells from patients with PMF with or without JAK2V617F mutations in comparison to CD34+ cells from healthy donors (GSE53482). (E) Comparative GSEA analysis depicting significantly positively enriched gene sets (FDR q-value < 0.01) in Nol3−/− MPN (vs. Nol3+/+) Thy1+LSK cells and CD34+ cells from PMF patients (vs. healthy controls). P < 2.2 × 10⁻¹⁶; odds ratio, 28.19. (F) Comparative GSEA analysis depicting significantly positively enriched gene sets (FDR q-value < 0.01) in Nol3−/− MPN (vs. Nol3+/+) Thy1+LSK cells and CD34+ cells from PMF patients dichotomized by high and low NOL3 expression. P < 2.2 × 10⁻¹⁶; odds ratio, 27.99. (G) Commonly deleted region (hg18) on chromosome 16 in human patients with myeloid malignancies. Yellow, NOL3 locus; pink bars, length of region with UPD; green bars, length of chromosomal deletion. (H) NOL3 mRNA normalized expression in sorted LT-HSCs from healthy control subjects (n = 4) and from patients with complex karyotype AML (n = 5). Bars represent mean values. Error bars represent ±SD; *, P < 0.05.

