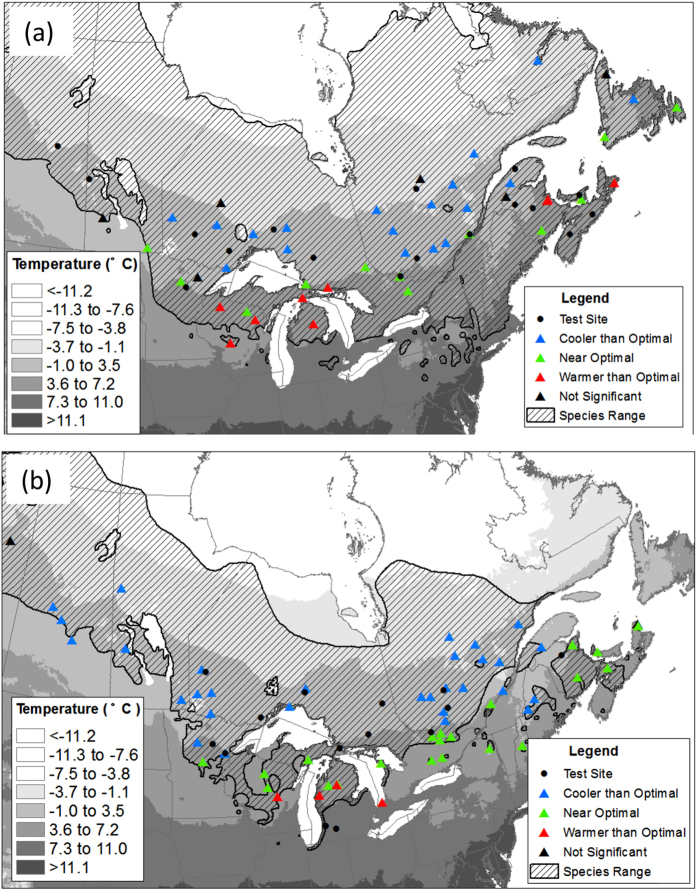
Figure 1.
Test sites (circles) and seed sources (triangles) used in (a) black spruce and (b) jack pine provenance trials. Differentiated on the map are populations growing at temperatures >1 °C cooler than optimal (blue triangles), within ± 1 °C of optimal (green triangles), and >1 °C warmer than optimal (red triangles). Also shown is the spatial distribution of mean annual temperature values and the geographic range of each species (hatching). Maps were drawn using ARCGIS v.9.3 (ESRI, Redlands, CA, USA; http://www.esri.com/arcgis/about-arcgis).

