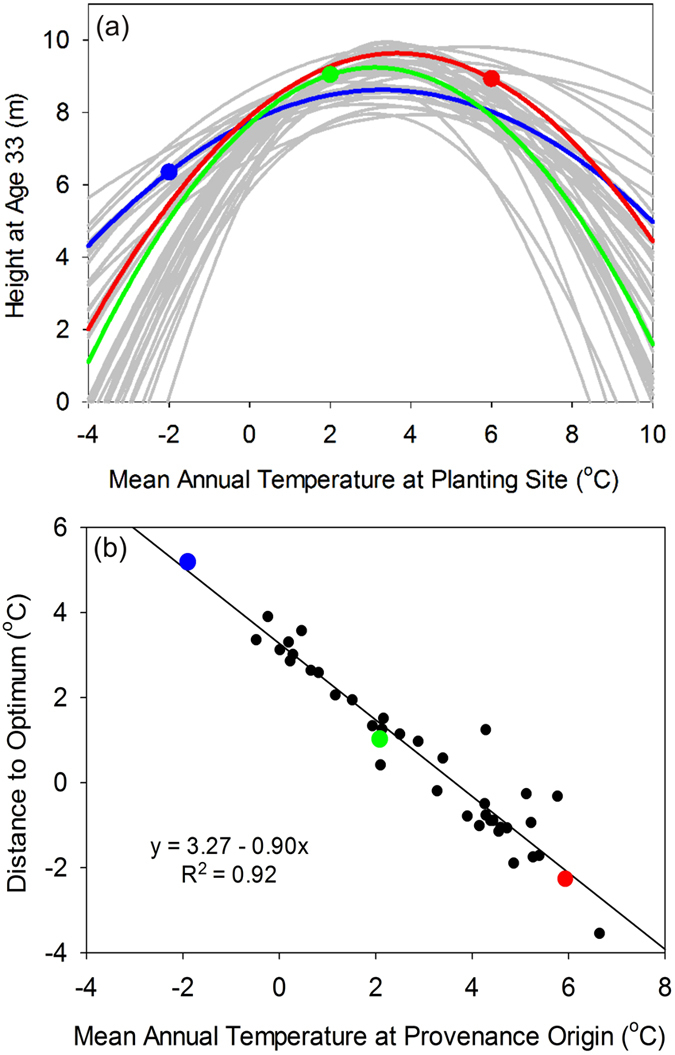
Figure 2.

Provenance data summaries for black spruce showing: (a) response curves for 39 seed sources (gray), including representative seed sources originating from warm (red), cold (blue), and moderate (green) locations; and (b) distance to optimal MAT for 39 seed sources (black dots), highlighting the same representative seed sources as those shown in Fig. 2a.
