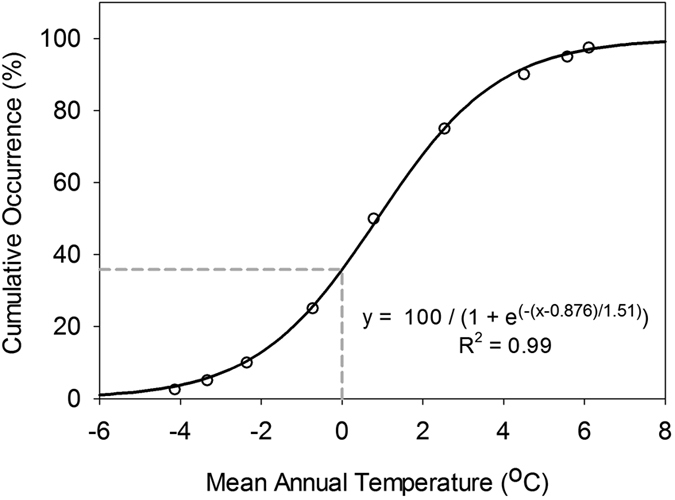
Figure 5.

A cumulative occurrence curve for black spruce in relation to mean annual temperature. The data points were obtained from a North American plant occurrence database (http://planthardiness.gc.ca/) and were fit using a sigmoidal curve. As an example, the gray dotted line indicates the MAT percentile associated with a MAT value of 0 °C.
