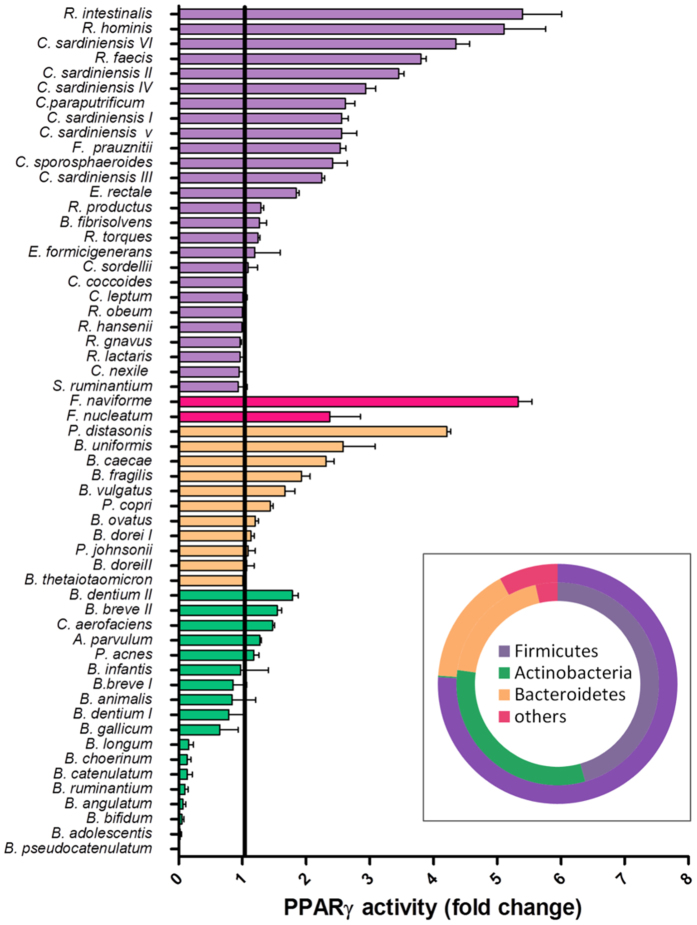
Figure 1. Effect of conditioned media (CM) on transcriptional activity of PPARγ in HT-29-PPARγ reporter cells.
Activation expressed as the fold increase towards its control (growth-medium) are represented as bar plot. Bacteria are sorted by response in decreasing order and grouped by phylum (violet = Firmicutes, pink = Fusobacteria, yellow = Bacteroidetes, green = Actinobacteria). Distribution of the bacterial phyla is represented in the doughnut chart on the bottom right. The inner circle represents the screened collection, the outer circle the phyla representation in the human colon based on the MetaHIT data.

