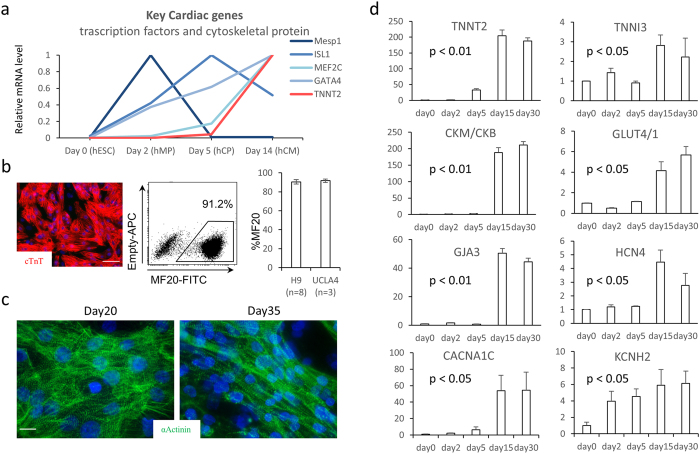
Figure 1.
(a) mRNA relative expression over the time course of hESC differentiation toward cardiac lineages. The value is standardized to the peak value of the time points for each gene. (b) Immunofluorescent staining for α-actinin in red showing over 90% are positive for α-actinin (scale bar = 100 um) (c) Morphological changes in hESC-CMs over the time course. Representative optical images of hESC-CMs on MEA on Day 20 and Day 35 (fluorescent staining: α-Actinin in green, nucleus in blue, scale bar = 10 um). (d) mRNA relative expression by qPCR standardized to the expression of day0 over the time course of cardiac differentiation/maturation.

