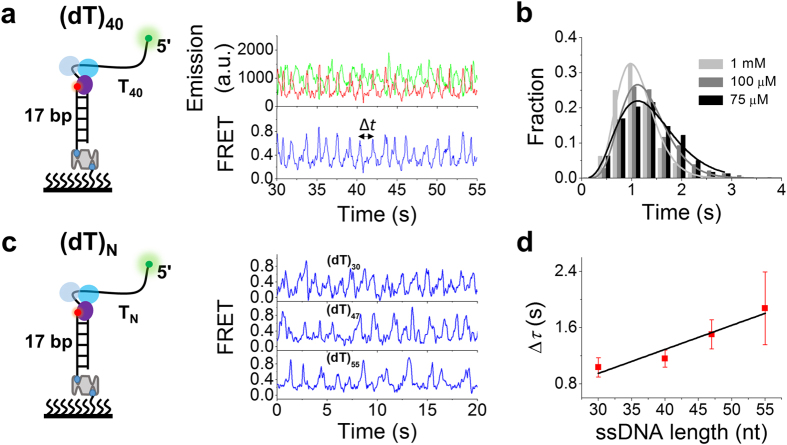
Figure 4. WRN loops 5′ ssDNA periodically.
(a) Typical time traces of fluorescence intensities of Cy3 and Cy5 and FRET obtained with (dT)40. Δt is defined as the time between two successive FRET peaks. (b) Histograms of Δt at different ATP concentrations were best fitted by a γ-distribution with time constant Δτ = 1.12, 1.31 and 1.42 s for 1 mM (27 traces), 100 μM (30 traces) and 75 μM ATP (20 traces), respectively. (c) Representative time traces of FRET showing repetitive looping of 5′-ssDNA tails with different lengths. (d) Time constant Δτ versus 5′-tail length at 1 mM ATP. A WRN translocation rate of 30 ± 6 nt/s was obtained by a linear fit of the data (Error bar = s.e.m.).

