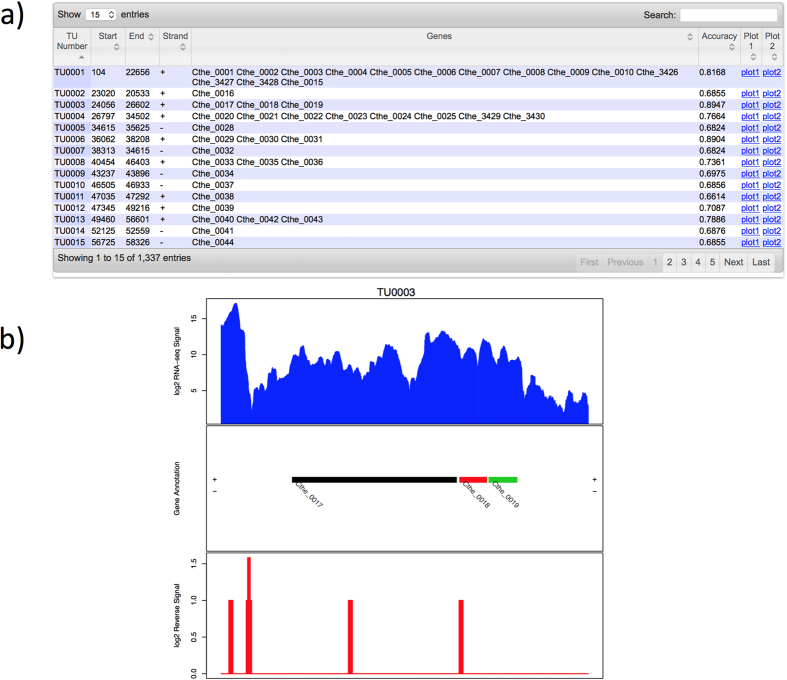
Figure 4. Screenshots of the SeqTU result pages for SRR578142.
(a) The final TU prediction table; and (b) An example of computed expression levels over an identified TU in strand-specific dataset, where the blue histogram represents the read depth over a TU in forward strand, with the middle part showing the genes in a TU, and the red histogram represents the read depth over a TU in reverse strand.

