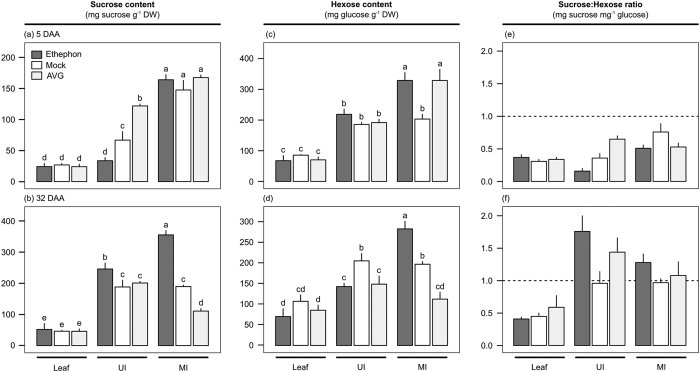
Figure 1.
Sucrose (a,b) and hexose (reducing sugars, (c,d)) contents (mg sugar g−1 dry weight) and sucrose:hexose ratio (e,f) in leaf and upper (UI, immature) and middle (MI, maturing) internodes of sugarcane plants at five (a,c,e) and 32 (b,d,f) days after ethephon (dark gray), mock (white), or AVG (light gray) application (DAA). Each bar represents the average of four replicates (individual plants), including the standard error of the mean (SEM). The letters denote significant differences using two-way ANOVA (chemical versus tissue interaction, p-value < 0.05) followed by LSD test (p-value < 0.05).

