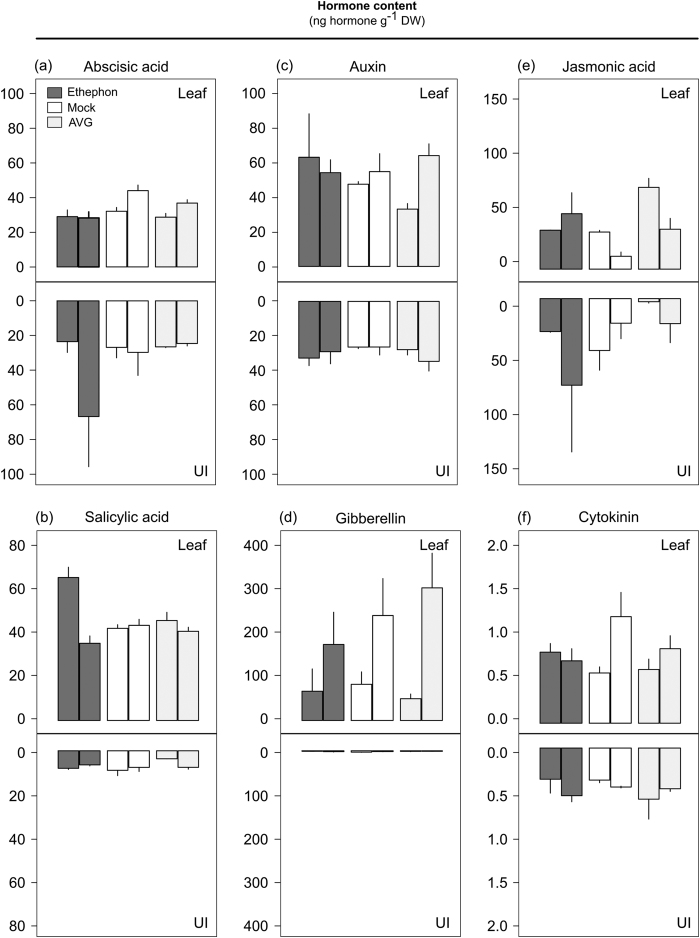
Figure 6. Hormone concentration (ng g−1 of dry weight) in leaves and upper internodes (UI) of sugarcane plants treated with ethephon, mock (water), and AVG at one and five days after chemical application (consecutive bars, respectively).
(a) Abscisic acid (ABA). (b) Salicylic acid (SA). (c) Auxin (IAA). (d) Gibberellin isoform 4 (GA). (e) Jasmonic acid (JA). (f) Cytokinin, trans-zeatin (CK). Each bar represents the average of four replicates (individual plants), including the standard error of the mean (SEM).

