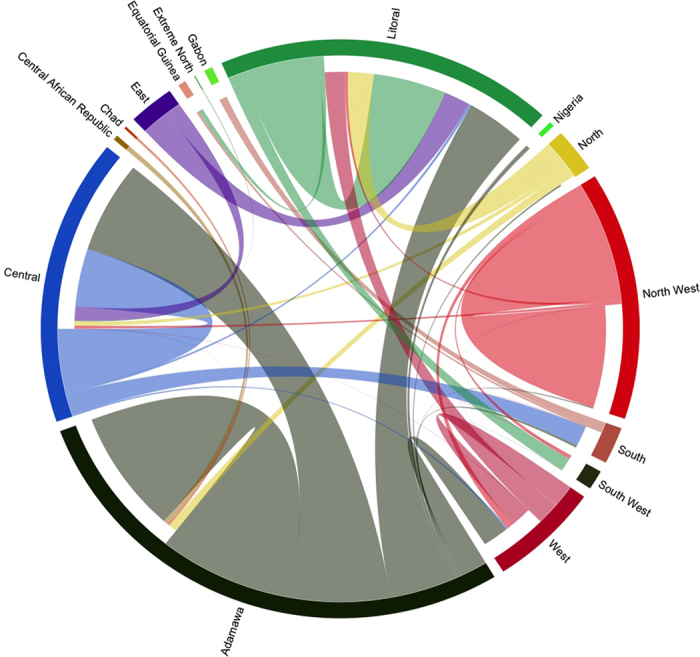
Figure 2. Cattle flow in the livestock market system in Cameroon.

The origin and destination of traded cattle are represented in this circular map. Each sector of the circle represents a Region of Cameroon or a neighboring country involved by the cattle flow in the region. Outgoing animal flow starts from the base of each sector while received movements do not reach the base of the relevant sector. For instance, the North-West Region, in red, trades most of its animals within the same Region and only very small proportion of them are moved to the Littoral, Central, West and South-West Regions of Cameroon or are introduced from the Adamawa Region.
