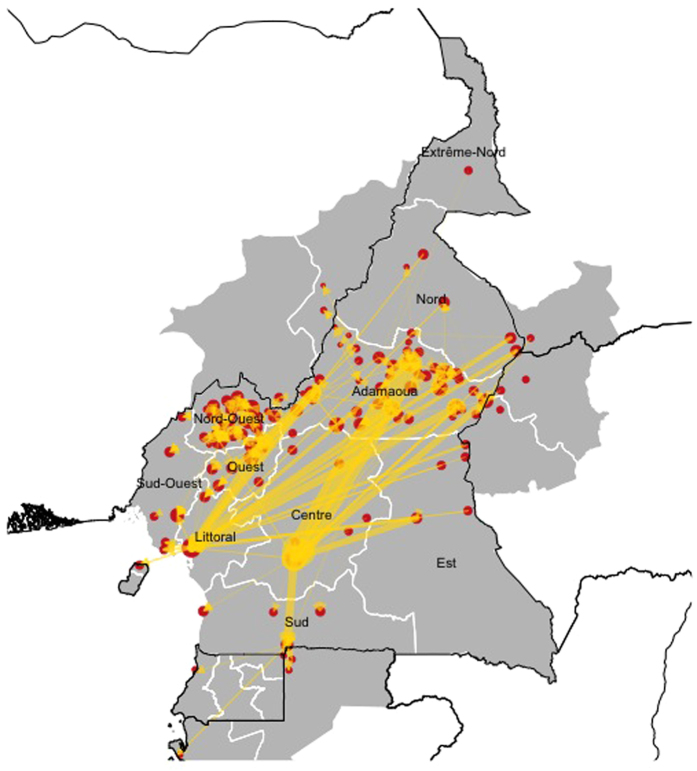
Figure 3. Cattle trading network in Cameroon and neighbouring areas.
Node sizes in the map are weighted by the relative value of eigenvector centrality. Ties show the direction of the cattle movement as indicated by the arrows and the proportional volume of traded animals is indicated by the thickness of the arrow (Generated using R statistical software40 (version 3.2.3) using the raster, rgdal and ggplot2 packages, and shp files obtained from the GADM database of Global Administrative Areas (source: www.gadm.org)49.

