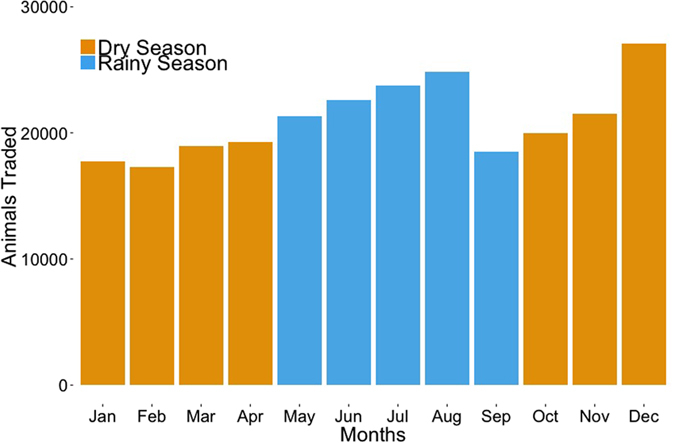
Figure 4. Volume of cattle traded through the network by month over a 12 month period.

Blue bars refer to the rainy season (May to September) while yellow bars refer to the dry (October to April). Between September 2013 and August 2014, a total of 252,831 cattle were moved through the network.
