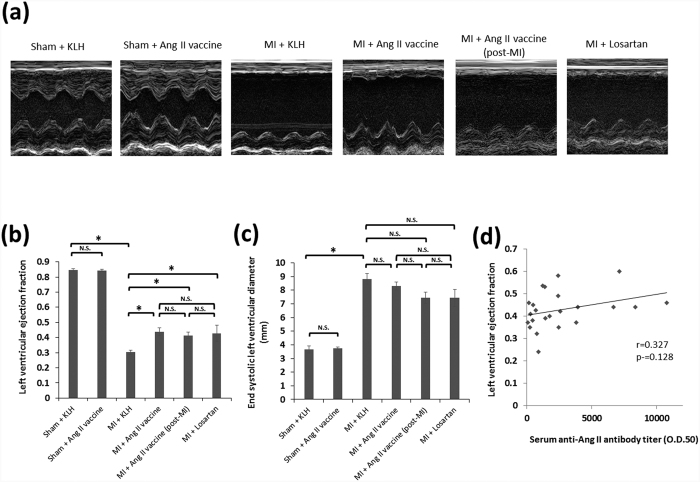
Figure 3. The effects of each of the treatment approaches on cardiac dysfunction after MI.
(a) Representative M-mode echocardiograms on day 56. A quantitative analysis of (b) the left ventricular ejection fraction and (c) the end-systolic left ventricular diameter. Sham + KLH, n = 5; Sham + Ang II vaccine, n = 5; MI + KLH, n = 11; MI + Ang II vaccine, n = 13; MI + Ang II vaccine (post-MI), n = 10; MI + losartan, n = 7. *p < 0.05 by the Tukey–Kramer post hoc test. (d) The correlation between the left ventricular ejection fraction and the serum anti-Ang II antibody titer in the MI + Ang II vaccine and MI + Ang II vaccine (post-MI) groups.

