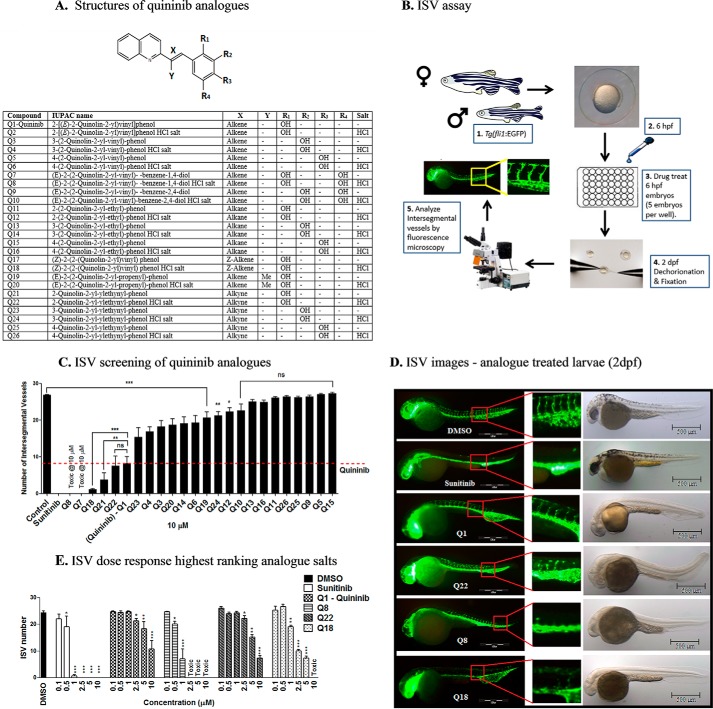
FIGURE 1.
Analogues more effectively inhibit developmental angiogenesis compared with quininib in vivo. A, structural skeleton of the quininib drug series and table listing the differences in chemical structures of all quininib analogues. A synthesis scheme for each chemical is included in Kennedy et al. (29). B, schematic of the intersegmental vessel assay. Male and female Tg(fli1:EGFP) zebrafish were in-crossed, yielding embryos that were treated with quininib analogues at 6 hpf. Larvae were dechorionated and fixed at 2 dpf, and intersegmental vessels were counted by visualizing under fluorescence microscopy. C, ranking graph of the bioactivity of 24 salt or amine analogue formulations comparing the ability of a 10 μm concentration of each analogue to inhibit developmental angiogenesis in the ISV assay using Tg(fli1:EGFP) zebrafish. D, fluorescence images of Tg(fli1:EGFP) treated with the most effective concentrations of analogues (0.1% DMSO, 10 μm sunitinib, 10 μm Q1, 10 μm Q22, 1 μm Q8, and 5 μm Q18). E, dose-response graph following rescreening of quininib analogues in the ISV assay at concentrations increasing from 0.1 to 10 μm. Individual experiments consisted of treating five embryos per well in duplicate (10 embryos), and individual experiments were conducted three times (n = 3). Statistical analysis was performed by ANOVA and Dunnett's or Bonferroni's post hoc multiple comparison test. Error bars are mean ± S.E. *, p < 0.05; **, p < 0.01; ***, p < 0.001; ns, not significant.

