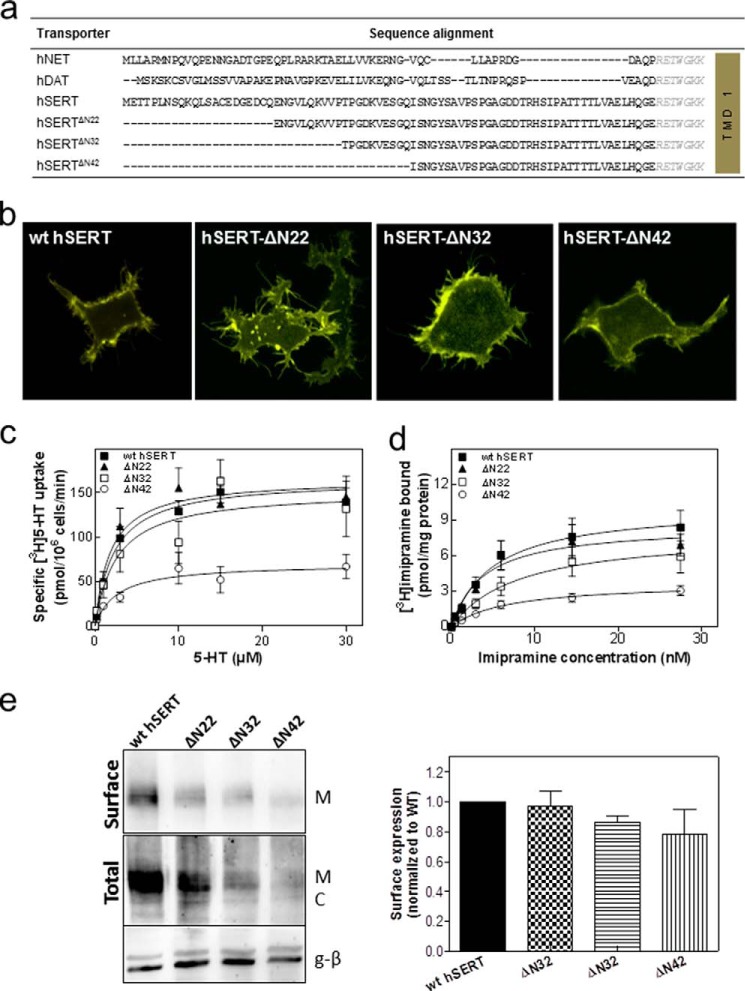
FIGURE 2.
Alignment of the N-terminal sequences of NET, DAT, and SERT (a); cellular distribution (b); substrate uptake (c); and inhibitor binding of YFP-tagged SERT-ΔN22, SERT-ΔN32, and SERT-ΔN42 in comparison with wild type SERT. a, comparison of the amino acid sequence of the N-terminal region of the human (h) monoamine transporter subfamily, indicating poor sequence conservation apart from the highly conserved RETWGKK motif (in italics) adjacent to the first transmembrane helix (TMD 1). The N terminus of hSERT comprises 85 amino acids. The first 22, 32, or 42 amino acids of the N terminus were truncated, resulting in SERT-ΔN22, SERT-ΔN32, and SERT-ΔN42. b, representative images showing the cellular localization of YFP-tagged wild type SERT, SERT-ΔN22, SERT-ΔN32, and SERT-ΔN42 obtained by confocal laser-scanning microscopy. c, serotonin uptake by HEK293 cells expressing YFP-tagged wild type SERT (closed squares), SERT-ΔN22 (closed triangles), SERT-ΔN32 (open squares), and SERT-ΔN42 (open circles). Cells were incubated with the indicated concentrations of [3H]serotonin for 1 min at 22 °C as outlined under “Experimental Procedures.” Nonspecific uptake was determined in the presence of 10 μm paroxetine and subtracted (<10% of total uptake). Data are means ± S.E. from four independent experiments carried out in triplicate. d, membranes (15–25 μg/assay) prepared in parallel from the same transiently transfected HEK293 cells shown in c were incubated with the indicated concentrations of [3H]imipramine for 20 min at 22 °C as outlined under “Experimental Procedures.” Nonspecific binding was determined in the presence of 10 μm paroxetine and subtracted (<20% of total binding at the highest concentration of [3H]imipramine). Data are means ± S.E. from four independent experiments carried out in duplicate. The solid lines in c and d were drawn by subjecting the data to a non-linear least square fit to the equation for a rectangular hyperbola. e, biotinylation of cell surface proteins was carried out in HEK cells expressing the indicated versions of SERT. Top panel, surface expression; bottom panels, total lysate fractions and G protein β-subunit (g-β) (as a loading control). The integrated intensity of the biotinylated bands (M) was quantified by ImageJ relative to the total amount of SERT immunoreactivity in the lysate (i.e. the bands with mature glycosylation (M) and core glycosylation (C)) and normalized to wild type. The data presented in the bar graph are means ± S.E. (error bars) (n = 4).

