FIGURE 3.
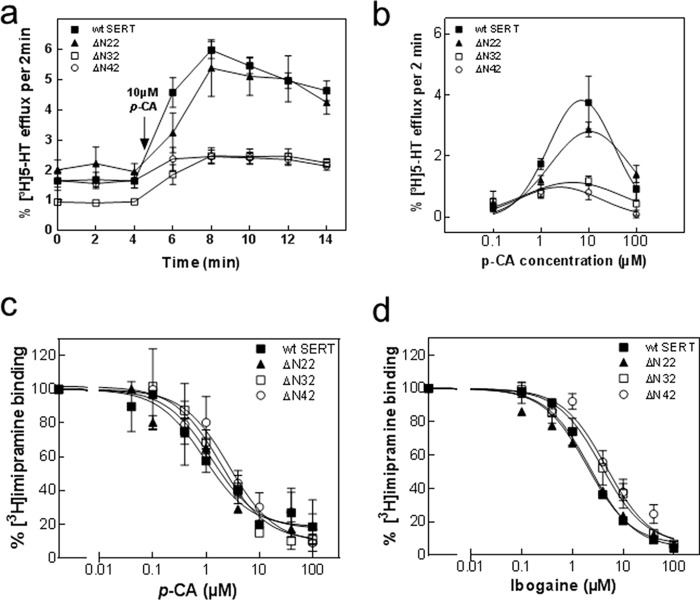
p-Chloroamphetamine-induced efflux of [3H]serotonin from HEK293 cells expressing wild type SERT, SERT-ΔN22, SERT-ΔN32, and SERT-ΔN42 (a and b) and inhibition of [3H]imipramine binding to membranes from these cells by p-chloroamphetamine (c) and ibogaine (d). a, HEK293 cells transiently expressing either YFP-tagged wild type SERT (closed squares), SERT-ΔN22 (closed triangles), SERT-ΔN32 (open squares), and SERT-ΔN42 (open circles) were preloaded with 0.4 μm [3H]serotonin for 20 min at 37 °C and subsequently superfused with Krebs-HEPES buffer for 45 min at 22 °C to obtain a stable basal efflux as outlined under “Experimental Procedures.” Thereafter, three fractions (2 min each) were collected to verify stable efflux. Subsequently, efflux was triggered by superfusion of the cells with 10 μm p-CA (administration indicated in the graph by an arrow), and five fractions (2 min each) were collected. Data are expressed as fractional release (see “Experimental Procedures”) and represent means ± S.E. from four independent experiments carried out in triplicate. b, concentration-response curve for p-chloroamphetamine-triggered efflux of [3H]serotonin. The experiments were done as in a in the presence of the indicated concentrations of p-chloroamphetamine. Plotted is the peak efflux from which basal efflux was subtracted. Data are means ± S.E. from four independent experiments carried out in triplicate. c and d, membranes (15–25 μg/assay) prepared from HEK293 cells expressing YFP-tagged wild type SERT (closed squares), SERT-ΔN22 (closed triangles), SERT-ΔN32 (open squares), and SERT-ΔN42 (open circles) were incubated in the presence of 5 nm [3H]imipramine and the indicated concentrations of p-chloroamphetamine (c) and ibogaine (d) for 20 min at 25 °C. Nonspecific binding was determined in the presence of 10 μm paroxetine and subtracted to obtain specific binding. In the absence of competitors, specific binding was in the range of 30 and 100 fmol and defined as the 100% reference value to normalize for interassay variations. Data are means ± S.E. from three to four independent experiments carried out in duplicate. Error bars represent S.E.

