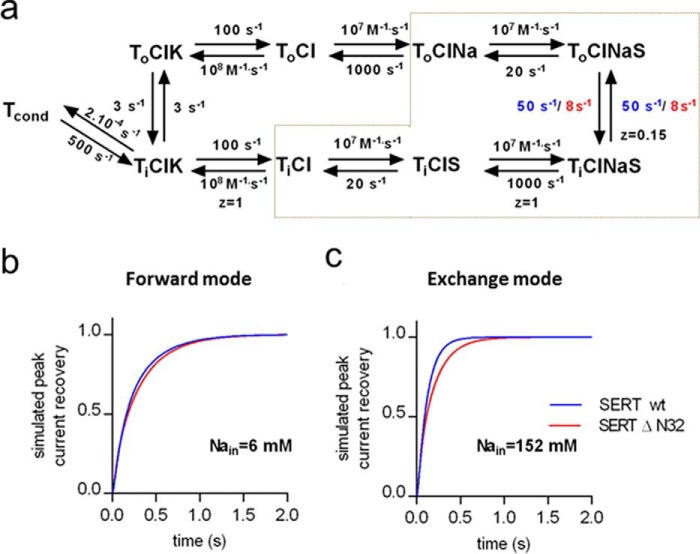
FIGURE 6.
A concise kinetic model of the transport cycle of SERT. a, schematic representation of the transport cycle. To and Ti refer to the outward and inward facing conformations of the transporter, respectively. To sequentially binds sodium (Na) and substrate (S) in the outward facing state, switching to the inward facing state where it releases sodium and substrate and takes up potassium (K) to return to the outward facing state and thus complete the cycle. Tcond, conducting state of the transporter. Rate constants for the individual steps are placed adjacent to the corresponding reaction arrows. The association and dissociation of chloride was omitted to simplify the kinetic modeling. z indicates the valence of the pertinent reaction. In the exchange mode, the transporter only visits the conformational states encompassed by the gray dashed lines. The time course of peak current recovery of wild type SERT and SERT-Δ32N was simulated by allowing the indicated rate constants (wild type SERT in blue and SERT-Δ32N in red) to vary. All other parameters were shared in the simulations, and the concentrations of Na+, K+, and substrate were set to the concentrations used in the experiments. b, time course of peak current recovery simulated for the recording condition of Fig. 4 in which the transporter favors the forward mode. c, time course of peak current recovery for the condition of Fig. 5 in which the transporter favors the exchange mode. The solution in which the rate of transition between inward and outward facing step differs by a factor of 6 recapitulates the experimental observation (Figs. 4d and 5d).

